
설명
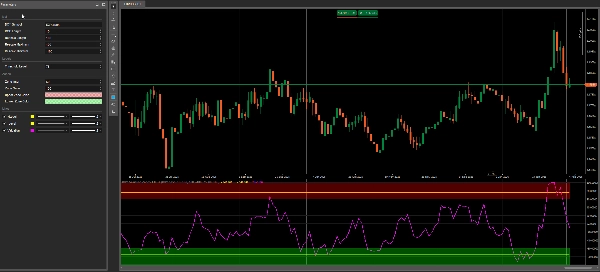
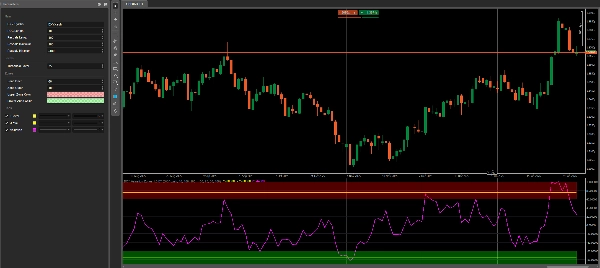
DXY Valuation Zones 1.0 BT는 차트 심볼에 대해 깔끔한 DXY 상대 가치 평가 라인을 보여주며 두 가지 간단한 컨텍스트 영역을 강조합니다: 과대 영역과 과소 영역입니다.
이것은 일간(D1) 컨텍스트 필터로 구축되어 — 복잡함 없이 명확한 영역과 구성 가능한 ±임계값 레벨만 제공합니다.
모든 영역 색상은 기본 cTrader 색상 선택기를 사용하므로 팔레트 내 불투명도 슬라이더를 통해 투명도를 직접 조절할 수 있습니다.
권장 사용법 (일간에 가장 적합)
이 지표는 USD 관련 통화쌍에 가장 적합합니다, 왜냐하면 DXY가 광범위한 USD 강세를 나타내기 때문입니다.
예시:
- XXXUSD: EURUSD, GBPUSD, AUDUSD, NZDUSD
- USDXXX: USDJPY, USDCAD, USDCHF
빠른 시작 (권장 기본값)
- 시간 프레임: 일간(D1)
- 과대 영역: +70 … +100
- 과소 영역: -70 … -100
- 임계값: ±75 (조정 가능)
- DXY 심볼:
DXY.cash(또는 귀하의 브로커 DXY 이름)
작동 방식 (간단히)
- 차트 심볼에 대해 ROC (백분율 변화)를 계산합니다
- 같은 ROC를 DXY에 대해 계산합니다
- 차이 (심볼 ROC – DXY ROC)를 사용합니다
- 결과를 안정적인 -100 … +100 범위로 재조정합니다
읽는 방법
- 가치 평가 > +임계값 → 과대 / “과대” 컨텍스트
- 가치 평가 < -임계값 → 과소 / “과소” 컨텍스트
- 그 사이 → 중립 컨텍스트
독립적인 진입 신호가 아니라 편향 및 위치 필터로 사용하세요.
중요 (브로커 요구사항)
이 지표는 브로커가 제공하는 DXY 심볼이 필요합니다 (예: DXY.cash).
✅ FTMO에서 테스트됨 (가용성 및 명칭은 브로커 피드에 따라 다를 수 있습니다).
브로커가 다른 이름을 사용하는 경우, 단지 DXY 심볼을 변경하세요 pa
요약
지표 프로필
고객 리뷰
4.5
리뷰: 2
5 | 50 % | |
4 | 50 % | |
3 | 0 % | |
2 | 0 % | |
1 | 0 % |
고객 리뷰
February 10, 2026
The cleanest use is messy areas become easier to avoid. It works better with a written plan.
February 6, 2026
Tested small first and that felt like the right move, and Half size is enough at the start.
상담
자주 묻는 질문(FAQ)
Prop
Forex
Signal
트레이딩 봇, 지표, 플러그인 등 cTrader Store에서 제공되는 상품은 제3자 개발자에 의해 제공되며, 이는 단순히 정보 및 기술적 접근을 목적으로 제공된 것입니다. cTrader Store는 중개인이 아니며, 투자 조언, 개인별 추천 또는 향후 성과에 대한 어떠한 보장도 제공하지 않습니다.


!["[Stellar Strategies] Inside Bar with Signals" 로고](https://cdn.ctrader.com/image/webp/1d9e8bfa-3b2c-4440-bb37-5856902008a7_30683)


!["[Hamster-Coder] Pivot Points MTF" 로고](https://cdn.ctrader.com/image/webp/4c143e5a-309c-40e3-a578-f04d1e133ffa_31159)


!["[Stellar Strategies] MARSI Signal Plotter" 로고](https://cdn.ctrader.com/image/webp/7b2b8da6-8f8e-4646-8d4a-4710c516c01e_25567)


가격
48
판매
1.03K
무료 설치