
FZ
Indicador
Versión 1.0, Mar 2026
Windows, Mac
4.0
Valoraciones: 2
Descripción
Indicador FZ para cTrader
Descripción
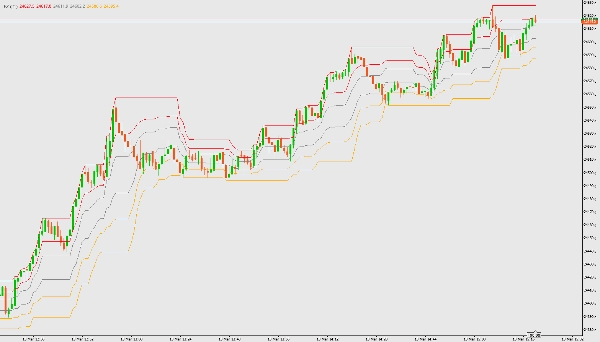
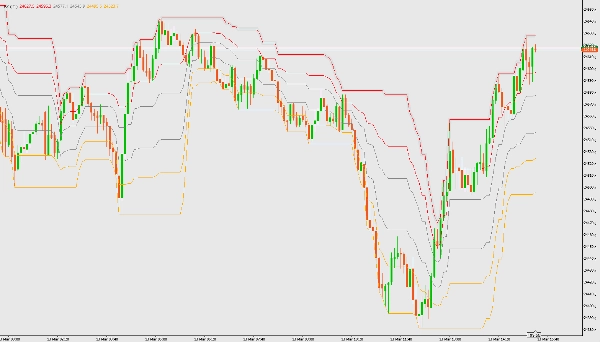
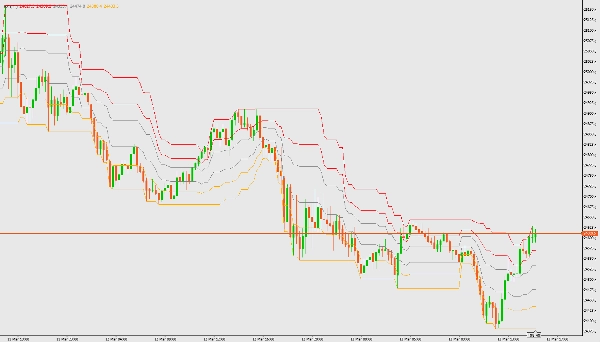
El indicador FZ dibuja zonas de canal de Fibonacci basadas en los precios más altos y más bajos durante un período definido por el usuario. Ayuda a identificar zonas de tendencia y posibles áreas de reversión.
Características
- Calcula los bordes del canal y los niveles de Fibonacci (0.236, 0.382, 0.618, 0.786)
- Visualiza zonas de tendencia alcista, lateral y bajista
- Superposición en el gráfico de precios
Parámetros
- calcular para las últimas ## barras: Número de barras a usar para el cálculo (por defecto: 21)
Cómo usar
- Descargue y agregue el archivo del indicador FZ (FZ.cs) a su plataforma cTrader.
- Compile el indicador en cTrader Automate.
- Adjunte el indicador a cualquier gráfico.
- Ajuste el parámetro para el número de barras según sea necesario.
- Interprete las zonas coloreadas:
-
- Cian: Zona de tendencia alcista (comprar)
- Gris: Zona lateral (esperar cambio de tendencia)
- Naranja: Zona de tendencia bajista (vender)
Resumen
Perfil del indicador
Valoraciones de clientes
4.0
Valoraciones: 2
5 | 0 % | |
4 | 100 % | |
3 | 0 % | |
2 | 0 % | |
1 | 0 % |
Conversación
Preguntas frecuentes
BTCUSD
Forex
Signal
Breakout
Indices
EURUSD
Commodities
GBPUSD
NZDUSD
Prop
Scalping
Crypto
Grid
Stocks
AI
XAUUSD
NAS100
USDJPY
Los productos disponibles a través de cTrader Store, incluidos bots, indicadores y plugins para operar, son proporcionados por desarrolladores de terceros y están disponibles únicamente con fines informativos y de acceso técnico. cTrader Store no es un bróker, por lo que no proporciona asesoramiento de inversión, recomendaciones personales ni ninguna garantía de rentabilidad futura.
Más de este autor


Precio
Desde 10/03/2026
105
Instalaciones gratis