
VegaXLR - Auto Support and Resistance
Indicador
5 compras
Versión 1.0, Feb 2025
Windows, Mac
4.3
Valoraciones: 3
Descripción
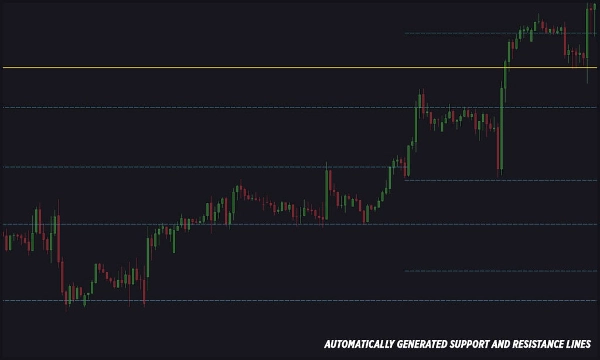
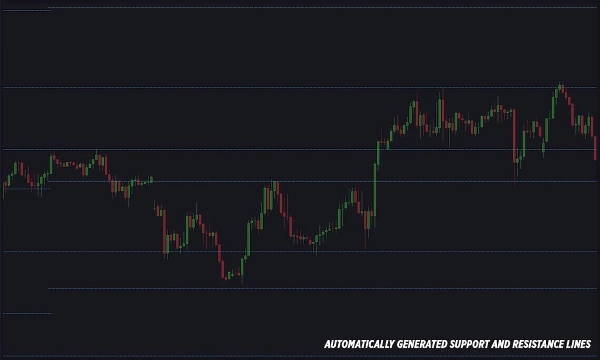
Este indicador de cTrader dibuja automáticamente líneas de soporte y resistencia en tu gráfico, facilitando su uso tanto para principiantes como para profesionales. Las líneas se generan basándose en niveles clave de Fibonacci y oscilaciones de precio (zigzags).
Características:
- Detecta y dibuja automáticamente líneas de soporte y resistencia.
- Estilos de línea, grosor y colores totalmente personalizables.
- Número ajustable de líneas de soporte y resistencia.
- Alertas cuando el precio interactúa con las líneas de soporte o resistencia.
- Múltiples opciones de alerta: Telegram, Email, ventanas emergentes y sonidos.
- Capacidad para elegir qué niveles de Fibonacci generan las líneas.
- Opción para activar alertas desde las líneas de precio Ask o Bid.
- Condiciones configurables de alerta: alertas al cierre de barra o alertas instantáneas al tocar el precio.
- Mensajes de alerta personalizables con comentarios definidos por el usuario.
- Opción para habilitar alertas solo para niveles fuertes de soporte y resistencia.
- Capacidad para capturar y enviar capturas de pantalla del gráfico vía Telegram (el gráfico debe estar visible).
- Configuración sencilla de alertas por email.
- Acceso rápido a la guía del usuario mediante un pequeño botón en el gráfico.
Resumen
Resumen de IA
VegaXLR - Auto Support and Resistance is a cTrader indicator that automatically identifies and draws support and resistance lines on trading charts. It uses key Fibonacci levels combined with price swing analysis (zigzags) to generate these lines, aiding traders in recognizing critical price levels. The indicator offers full customization of line styles, thickness, and colors, and allows adjustment of the number of support and resistance lines displayed.
It features real-time alerts triggered when price interacts with these levels, with configurable conditions such as bar-close or instant price-touch alerts. Alert notifications can be sent via multiple channels including Telegram, Email, pop-ups, and sounds. Users can specify which Fibonacci levels to use for line generation and choose whether alerts trigger from Ask or Bid price lines. Additional options include enabling alerts only for strong levels, customizing alert messages, and capturing chart screenshots to send via Telegram.
A user guide is accessible directly from the chart for ease of use. This tool supports Forex markets and is designed to assist both beginners and professionals in technical analysis by automating the detection of key support and resistance zones.
Perfil del indicador
Valoraciones de clientes
4.3
Valoraciones: 3
5 | 67 % | |
4 | 0 % | |
3 | 33 % | |
2 | 0 % | |
1 | 0 % |
Valoraciones de clientes
March 2, 2025
Focused trade layer if the trader wants it keeps attention on levels that actually matter. It works best as support, not a final decision maker. The cleanest use is 3 to 5 levels per chart, with 0.5 pullbacks checked before entry. not every zone holds, even if it looks clean.
March 1, 2025
March 1, 2025
Balanced demo helper for traders who build plans around market levels. It gives value around key price zones, but not every zone holds, even if it looks clean. I would wait for 2 reactions and avoid trades where the target is less than 1.5R. Levels are useful when they reduce noise, not when they crowd the chart.
Conversación
Preguntas frecuentes
Forex
Los productos disponibles a través de cTrader Store, incluidos bots, indicadores y plugins para operar, son proporcionados por desarrolladores de terceros y están disponibles únicamente con fines informativos y de acceso técnico. cTrader Store no es un bróker, por lo que no proporciona asesoramiento de inversión, recomendaciones personales ni ninguna garantía de rentabilidad futura.


![Logotipo de "[Hamster-Coder] Pivot Points MTF"](https://cdn.ctrader.com/image/webp/4c143e5a-309c-40e3-a578-f04d1e133ffa_31159)


Precio
215
Ventas
677
Instalaciones gratis