
Descripción
CVD Proporcional Clásico (Anclado)
Descubre la verdadera intención de los participantes del mercado con el CVD Proporcional Clásico. A diferencia de los indicadores estándar de Delta de Volumen Acumulado que simplemente suman el volumen de ticks, esta herramienta utiliza una Lógica Proporcional para ponderar el volumen basado en la acción real del precio dentro de cada barra.
¿Por qué Delta "Proporcional"?
El CVD estándar puede ser engañoso. Este indicador calcula el delta analizando la relación entre el rango de la barra (Alto-Bajo) y la distancia Cierre-Apertura. Esto asegura que el volumen se distribuya de manera realista:
- Velas de fuerte convicción (cerrando cerca del alto/bajo) contribuyen más al delta.
- Velas con mechas largas (signos de absorción o rechazo) neutralizan el delta, previniendo señales de volumen "falsas".
Características Clave
- ⚓ Anclaje Inteligente (Reinicio Multitemporal): Mantén tu análisis relevante para la sesión de trading actual. Elige reiniciar el cálculo Diariamente, Semanalmente o Mensualmente—o déjalo correr indefinidamente.
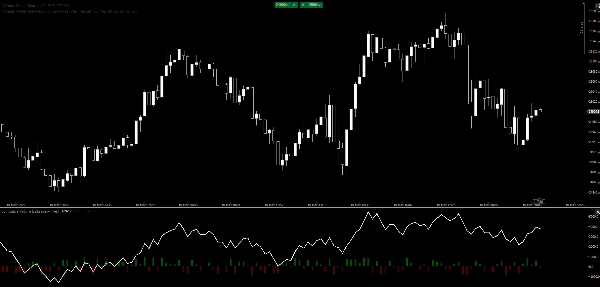
- 📊 Visuales Duales:
-
- La Línea CVD: Una línea limpia y de alto rendimiento para detectar divergencias a largo plazo y agotamiento de la tendencia.
- Superposición de Histograma: Retroalimentación visual instantánea sobre la presión de compra/venta por barra para identificar clímax o absorción de un vistazo.
- ⚡ Ultra Ligero: Escrito con optimización nativa en C# para cTrader, asegurando cero retraso incluso en máquinas de gama baja o mercados volátiles.
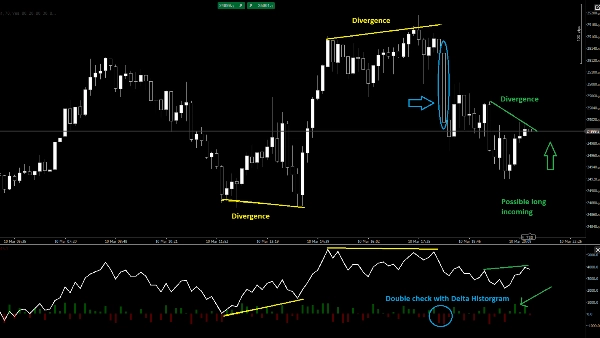
- 🎯 Detección de Divergencias: Identifica fácilmente cuando el precio está haciendo nuevos máximos mientras el CVD falla—una señal clásica de distribución institucional.
Cómo Operar con él
- Confirmación de Tendencia: Busca que la línea CVD tenga tendencia en la misma dirección que el precio.
- Absorción: Cuando el precio alcanza un nuevo mínimo pero el Histograma CVD muestra un fuerte "Delta Up" (Verde), los compradores están absorbiendo la presión de venta.
- Agotamiento: Observa un pico pronunciado en el histograma (Clímax) seguido de una reversión en la línea CVD.
Parámetros:
- Modo de Anclaje: Nunca, Diario, Semanal, Mensual.
- Mostrar Delta de Barra: Activa o desactiva el histograma.
Descubre la verdadera intención de los participantes del mercado con el CVD Proporcional Clásico. A diferencia de los indicadores estándar de Delta de Volumen Acumulado que simplemente suman el volumen de ticks, esta herramienta utiliza una Lógica Proporcional para ponderar el volumen basado en la acción real del precio dentro de cada barra.
¿Por qué Delta "Proporcional"?
El CVD estándar puede ser engañoso. Este indicador calcula el delta analizando la relación entre el rango de la barra (Alto-Bajo) y la distancia Cierre-Apertura. Esto asegura que el volumen se distribuya de manera realista:
- Velas de fuerte convicción (cerrando cerca del alto/bajo) contribuyen más al delta.
- Velas con mechas largas (signos de absorción o rechazo) neutralizan el delta, previniendo señales de volumen "falsas".
Características Clave
- ⚓ Anclaje Inteligente (Reinicio Multitemporal): Mantén tu análisis relevante para la sesión de trading actual. Elige reiniciar el cálculo Diariamente, Semanalmente o Mensualmente—o déjalo correr indefinidamente.
- 📊 Visuales Duales:
-
- La Línea CVD: Una línea limpia y de alto rendimiento para detectar divergencias a largo plazo y agotamiento de la tendencia.
- Superposición de Histograma: Retroalimentación visual instantánea sobre la presión de compra/venta por barra para identificar clímax o absorción de un vistazo.
- ⚡ Ultra Ligero: Escrito con optimización nativa en C# para cTrader, asegurando cero retraso incluso en máquinas de gama baja o mercados volátiles.
- 🎯 Detección de Divergencias: Identifica fácilmente cuando el precio está haciendo nuevos máximos mientras el CVD falla—una señal clásica de distribución institucional.
Cómo Operar con él
- Confirmación de Tendencia: Busca que la línea CVD tenga tendencia en la misma dirección que el precio.
- Absorción: Cuando el precio alcanza un nuevo mínimo pero el Histograma CVD muestra un fuerte "Delta Up" (Verde), los compradores están absorbiendo la presión de venta.
- Agotamiento: Observa un pico pronunciado en el histograma (Clímax) seguido de una reversión en la línea CVD.
Parámetros:
- Modo de Anclaje: Nunca, Diario, Semanal, Mensual.
- Mostrar Delta de Barra: Activa o desactiva el histograma.
Resumen
Key features include smart anchoring with multi-timeframe resets (daily, weekly, monthly, or continuous), dual visuals comprising a CVD line for spotting divergences and trend exhaustion, and a histogram overlay for immediate per-bar buying or selling pressure insights. The indicator is optimized in native C# for cTrader, ensuring high performance and low resource use.
Traders can use the indicator for trend confirmation by aligning CVD direction with price, identify absorption when price lows coincide with strong positive delta in the histogram, and detect exhaustion through histogram spikes followed by CVD reversals. Adjustable parameters include anchor mode and histogram display toggle.
This tool supports analysis across multiple markets and symbols, including Forex, cryptocurrencies, indices, commodities, and stocks.
Valoraciones de clientes
5 | 0 % | |
4 | 100 % | |
3 | 0 % | |
2 | 0 % | |
1 | 0 % |


