
Atlas Seasonal Returns Heatmap
指标
3 购买
版本 1.0, Sep 2025
Windows 版、Mac 版
4.5
评价:2
说明
🧭 按时钟计时您的交易:Atlas 显示市场按月份、星期几和小时的移动趋势。🧭
查看您的市场何时倾向于移动——按月份、星期几或小时。
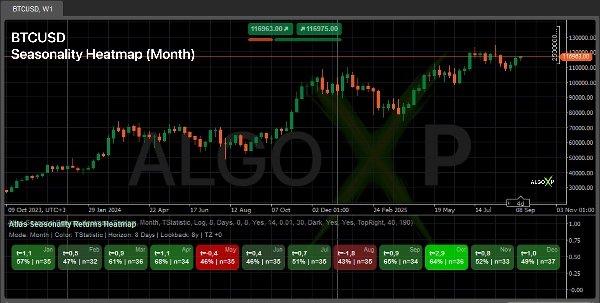
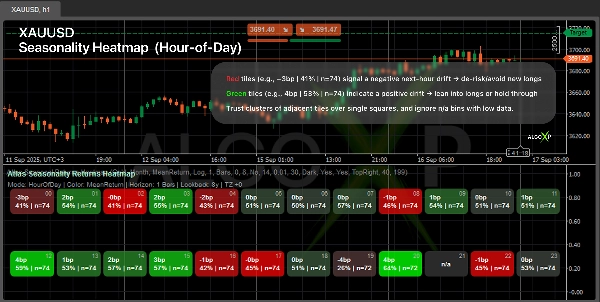
Atlas 计算 未来收益,基于您选择的时间范围,并绘制一个 对称热图(下 → 零 → 上)。每个格子显示一个指标(均值,T统计量,或 Sharpe比率)加上 命中率% | 样本数。用它来 把握入场/出场时机,规划交易时段,以及 过滤风险。
🎯 交易者为何使用它
- 发现 绿色窗口 以积极介入,红色窗口 则选择回避。
- 围绕 统计上有利的 小时/天规划交易时段。
- 为自由裁量和系统化策略添加一个清晰的 “时间”层。
⚙️ 工作原理
- 向前查看您选择的 时间窗口,总结该窗口内价格的典型表现。
- 将结果分组到 时间桶(月份/星期几/小时),并 尊重您的时区。
- 应用 异常值保护和每个桶的 稳健强度评分(加上样本量)。
- 使用您的 上涨/零/下跌 颜色绘制一个围绕中性平衡的 平衡热图。
👥 适用对象
- 自由裁量交易者 — 通过交易时段实现更好的时机和仓位控制。
- 系统和机器人开发者 — 为策略提供 时间过滤/时间仓位调整 层。
- 加密货币和指数交易者 — 快速识别跨天/小时的行为模式。
- 初学者 — 简单解读:绿色越多,表示您选择的时间范围内偏多的概率越大。
🚀 快速开始
- 选择 资产预设(外汇/加密/指数/黄金)。
- 设置 时间范围(例如,1小时 用于小时,1天 用于星期几/月份)。
- 调整 回溯期、最小观察数 和颜色。
- 阅读聚类(几个相邻的绿/红色格子)以获取最强信号。
ℹ️ 季节性并不保证未来结果。 它是一种统计模式,取决于时间段和方法论。将该指标作为 背景 用于您的入场/出场规则和风险管理,测试 多个回溯窗口的稳健性,并避免依赖 样本量较小的区间。
摘要
AI 摘要
Atlas Seasonal Returns Heatmap is an indicator designed to reveal when markets tend to move by analyzing forward returns over user-defined horizons. It displays a symmetric heatmap organized by time buckets—Month, Day-of-Week, and Hour-of-Day—using color-coded tiles that represent metrics such as Mean, T-stat, Sharpe ratio, along with hit percentage and sample size. This visualization helps traders identify statistically favorable periods to time entries and exits, plan trading sessions, and manage risk.
The indicator supports multiple asset presets including Forex, Crypto, Indices, and Commodities, and respects the user’s timezone. It applies outlier protection and calculates a robust strength score per time bucket to ensure reliable insights. Users can customize parameters like lookback period, minimum observations, and color schemes.
Atlas is suitable for discretionary traders seeking better timing and sizing, system and bot builders needing a time-based filter or sizing layer, crypto and index traders analyzing behavioral patterns, and beginners looking for a straightforward indication of positive or negative market bias. It provides a statistical context for entry/exit decisions and risk management but should be used alongside other analysis tools.
指标配置
客户评价
4.5
评价:2
5 | 50 % | |
4 | 50 % | |
3 | 0 % | |
2 | 0 % | |
1 | 0 % |
客户评价
October 1, 2025
One green trade proves nothing. It keeps weak ideas from looking too clean.
September 21, 2025
Two sessions say more than one clean chart. The checklist feels less annoying.
讨论
常见问答
BTCUSD
Forex
Indices
EURUSD
Commodities
GBPUSD
NZDUSD
Prop
Crypto
Stocks
XAUUSD
NAS100
USDJPY
cTrader Store 提供的所有产品,包括交易机器人、指标和插件,均由第三方开发者提供,仅供信息参考和技术访问之用。cTrader Store 并非经纪商,不提供投资建议、个人推荐或任何未来业绩保证。
该作者的其他作品


猜您喜欢


价格
注册日期 13/08/2025
437
销售
4.55K
免费安装