
说明
在智能资金概念(SMC)和ICT的世界中,价格失衡是大型机构投资者的“指纹”。当市场移动过快时,会留下一个公平价值缺口(FVG)——一个价格几乎总会回归“填补”或重新测试的低效区域。
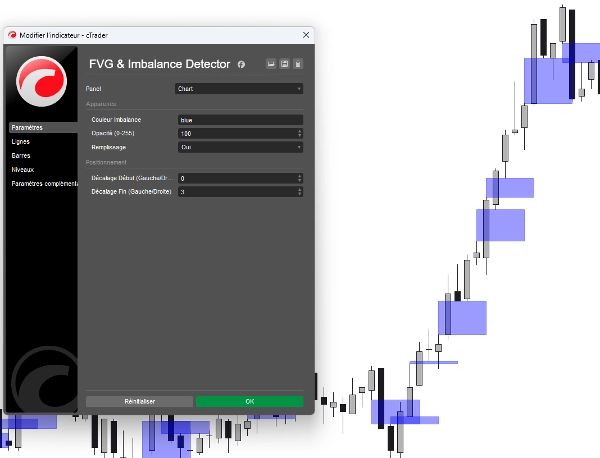
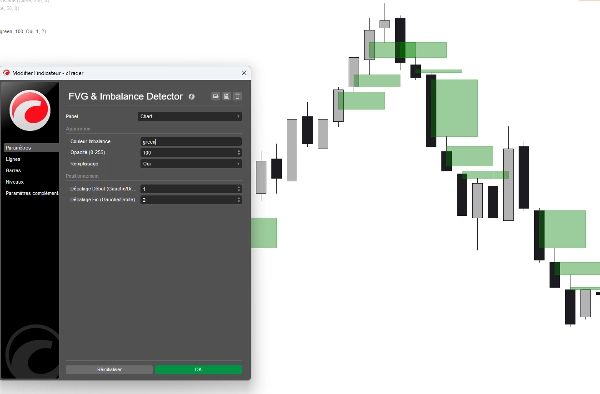
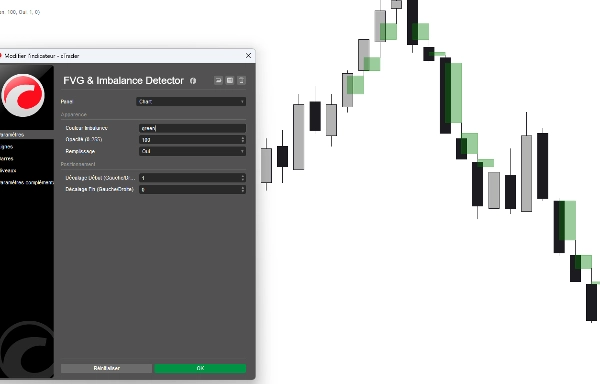
cTrader 的FVG & 失衡检测器是一款高性能工具,旨在自动识别这些低效区域。无需手动绘制——直接在图表上获得清晰且可操作的区域。
为什么这个指标必不可少:
- 🚀 捕捉机构动作:查看大型银行和对冲基金以巨大成交量进入市场的位置。
- 🎯 高概率区域:将识别出的失衡用作获利目标的磁性点,或作为精准入场的“黄金区域”。
- 📈 清晰可视化:高质量的矩形覆盖,使趋势分析轻松自如。
- 🔧 完全灵活:与基础指标不同,此版本允许您将区域延伸至未来,或调整起点以匹配您的特定策略。
独家功能:
- 智能检测逻辑:先进算法以像素级精度识别顶部(看跌)和底部(看涨)低效区域。
- 双向偏移:独有的“开始”和“结束”偏移参数允许您将区域向前或向后投射,以查看历史缺口如何与当前价格走势对齐。
- 专业色彩界面:通过干净的下拉菜单选择您喜欢的样式(黄色、水绿色、红色等)——无需再输入十六进制代码!
- 不透明度控制:调整透明度,使区域不会干扰您对价格走势的观察。
- 性能优化:轻量级代码,即使在多图表上也不会拖慢您的 cTrader 平台。
使用方法:
- 识别缺口:指标会绘制一个框,显示第一根蜡烛的高点与第三根蜡烛的低点之间的失衡区域。
- 等待回测:观察价格是否回到这些框内。
- 执行操作:在 FVG 区域内寻找拒绝形态,以实现低风险高回报的入场。
摘要
AI 摘要
The FVG & Imbalance Detector is an indicator for the cTrader platform designed to identify Fair Value Gaps (FVG) and price imbalances, key concepts in Smart Money Concepts (SMC) and Institutional Cycle Trading (ICT). These gaps represent zones of market inefficiency created by rapid price moves, often reflecting institutional activity. The indicator automatically detects and highlights these zones on the chart with clear rectangular overlays, eliminating the need for manual drawing.
Key features include detection of both bullish (bottom) and bearish (top) imbalances with high precision, customizable zone extensions via start and end offset parameters, and adjustable opacity and color settings for clear visualization. The tool is optimized for performance to avoid slowing down the platform, even when applied to multiple charts.
Traders can use the indicator to spot where large institutional players have entered the market, identify high-probability zones for entries or take-profits, and monitor price retests of these inefficiency zones for potential trade execution. The indicator supports analysis across various markets including Forex, Indices, Commodities, and Crypto.
指标配置
客户评价
4.0
评价:2
5 | 0 % | |
4 | 100 % | |
3 | 0 % | |
2 | 0 % | |
1 | 0 % |
客户评价
January 18, 2026
tested small first and that felt like the right move, and account protection still comes first.
January 14, 2026
讨论
常见问答
Forex
Indices
Commodities
Crypto
AI
cTrader Store 提供的所有产品,包括交易机器人、指标和插件,均由第三方开发者提供,仅供信息参考和技术访问之用。cTrader Store 并非经纪商,不提供投资建议、个人推荐或任何未来业绩保证。
该作者的其他作品


猜您喜欢


价格
注册日期 27/10/2025
10
销售