
说明
专业 Heikin Ashi 可视叠加 是希望获得 Heikin Ashi 蜡烛图趋势平滑优势,同时保持标准蜡烛图或条形图活跃的交易者的完美工具。
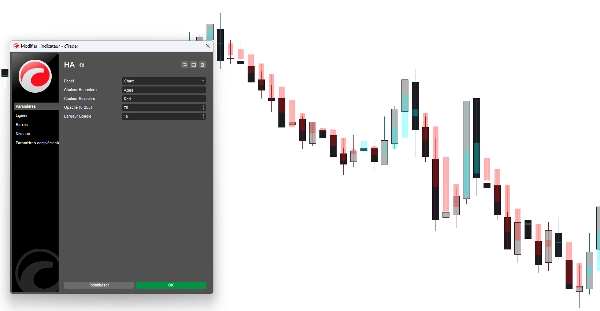
传统的 Heikin Ashi 图表要求您切换整个图表类型,这使得难以看到准确的价格动作。此指标通过绘制 Heikin Ashi 蜡烛作为 半透明叠加层,解决了这个问题,使您能够即时发现趋势反转和市场动量,而不会失去对真实价格的关注。
为什么使用此叠加层?
- 💎 噪音减少: Heikin Ashi 过滤市场噪音,使您更容易保持盈利交易。
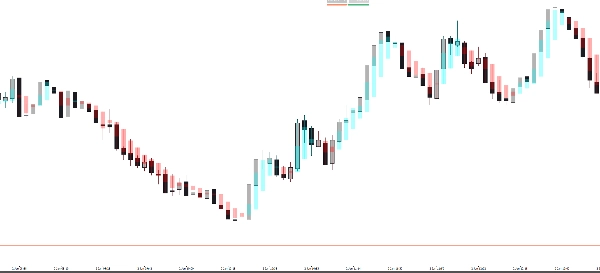
- 🕯️ 双图表视图: 保持您的标准蜡烛图用于价格动作/模式,同时使用 HA 叠加层观察趋势方向。
- 🎨 完全可定制: 调整不透明度和颜色以匹配您的工作空间(暗色或亮色模式)。
- 🚀 即时趋势识别: 蓝色(看涨)和红色(看跌)区域帮助您避免逆势交易。
主要特点:
- 智能透明度: 设置不透明度,使叠加层不会遮挡您的主要价格动作。
- 完美对齐: 实时计算以匹配当前时间框架的 Heikin Ashi 值。
- 专业设计: 干净的视觉效果,不会使您的图表杂乱。
- 通用: 适用于所有时间框架(M1 到月线)和所有资产(外汇、股票、加密货币、指数)。
使用方法:
- 将指标应用到您的图表。
- 调整 不透明度 和 实体宽度 以符合您的偏好。
- 使用 HA 蜡烛确认趋势强度:
-
- 趋势方向上的长影线 = 强劲动量。
- 两侧都有影线的小实体 = 潜在反转。
参数:
- 看涨颜色: 向上 HA 蜡烛的自定义颜色。
- 看跌颜色: 向下 HA 蜡烛的自定义颜色。
- 不透明度 (0-255): 控制蜡烛的“幽灵”感或实心程度。
- 蜡烛宽度: 调整 HA 蜡烛的厚度以完美适应您的缩放级别。
摘要
AI 摘要
The Pro Heikin Ashi Visual Overlay is an indicator designed to enhance trend analysis by overlaying Heikin Ashi candles on standard candlestick or bar charts. Unlike traditional Heikin Ashi charts that replace the entire chart type, this tool provides a semi-transparent overlay, allowing traders to observe smoothed trend signals while retaining visibility of actual price action.
Key features include noise reduction to filter market fluctuations, customizable opacity and colors for integration with different chart backgrounds, and real-time alignment with the current timeframe’s Heikin Ashi calculations. The overlay uses blue and red zones to indicate bullish and bearish trends, aiding in immediate trend identification. It supports all timeframes from one minute to monthly and is compatible with various asset classes including Forex, stocks, cryptocurrencies, commodities, and indices.
Users can adjust candle width and opacity to suit their chart zoom level and visual preferences. The indicator facilitates dual-chart viewing, enabling simultaneous analysis of precise price patterns and smoothed trend momentum. It is designed with clean visuals to avoid chart clutter and supports professional trading environments.
指标配置
客户评价
4.0
评价:1
5 | 0 % | |
4 | 100 % | |
3 | 0 % | |
2 | 0 % | |
1 | 0 % |
讨论
常见问答
Forex
Signal
Indices
Commodities
Crypto
Stocks
cTrader Store 提供的所有产品,包括交易机器人、指标和插件,均由第三方开发者提供,仅供信息参考和技术访问之用。cTrader Store 并非经纪商,不提供投资建议、个人推荐或任何未来业绩保证。
该作者的其他作品


价格
注册日期 27/10/2025
10
销售