
说明
狙击手区域专业指标
狙击手区域专业版 是一款高级分析工具,旨在直观识别大型机构在价格图表上的足迹。它结合了过去犹豫区的映射与烛台着色系统,揭示操纵动作和机构力量。该指标将市场混乱转化为清晰的操作区域,使交易者能够准确识别价格“争夺”的位置以及在新一轮扩张前倾向于测试的位置。
狙击手区域专业版的主要特点
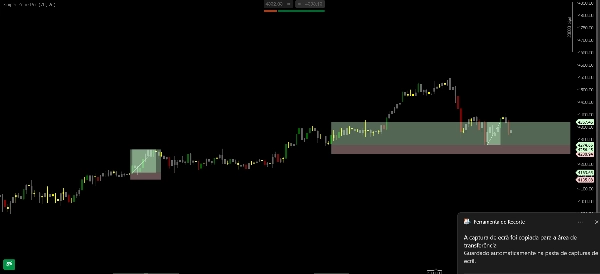
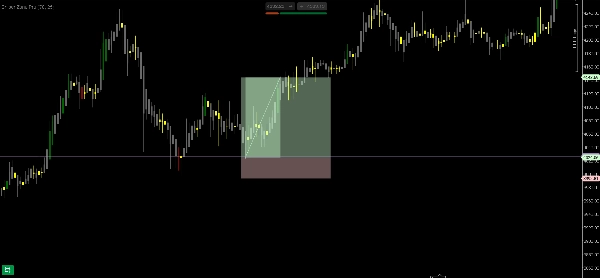
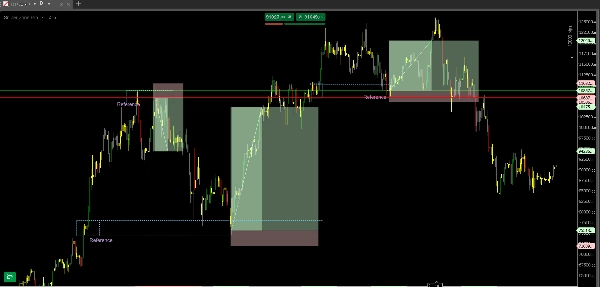
- “战斗区”映射: 自动识别价格积累成交量的犹豫区域。这些区域成为关键的“操作区”,因为它们代表买卖双方激烈争夺的价格水平。
- 活跃机构着色: 颜色系统不仅仅是美观;它突出显示具有机构运动特征(如高成交量或吸收)的烛台,将市场噪音与主要参与者的意图区分开来。
- 高概率测试区: 当价格达到关键区域时,指标帮助可视化价格是仅在测试该区域还是准备突破,提供更精确的入场触发信号。
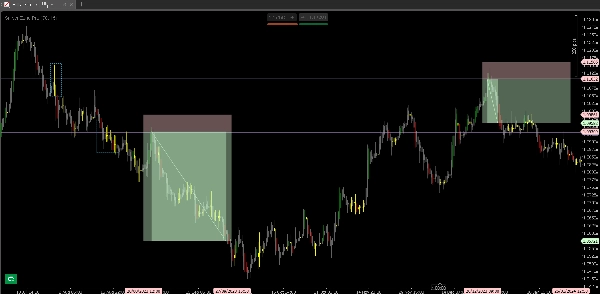
- 层级过滤器(HTF): 优先考虑更高时间框架中的兴趣区,这些区域的价格争夺具有更高的技术相关性和显著更高的回报潜力。
为什么使用狙击手区域专业版?
- 市场意图读取: 通过观察战斗区内的烛台颜色,交易者可以识别机构是在防守该位置还是放弃它。
- 定义操作区: 消除“在哪里交易”的疑虑。指标显示最佳机会不在行情中间,而是在价格先前表现出犹豫的区域测试中。
- 减少主观性: 交易者不再试图“猜测”顶部和底部,而是基于专业兴趣的验证区域进行操作。
摘要
AI 摘要
Sniper Zone Pro is an advanced trading indicator designed to visually identify institutional activity on price charts by mapping past indecision zones and applying a candle coloring system that highlights market manipulation and institutional strength. It automatically detects "battle zones" where price accumulated volume, marking key operational areas of buyer-seller disputes. The indicator’s color-coded candles reveal institutional movements such as high volume or absorption, helping traders distinguish significant market actions from noise. It also highlights high-probability test zones, indicating whether price is testing or ready to break through these critical levels. A hierarchy filter prioritizes zones from higher timeframes, emphasizing areas with greater technical relevance. Sniper Zone Pro supports multiple markets including Forex, cryptocurrencies, stocks, commodities, and indices, with tags referencing symbols like BTCUSD, EURUSD, GBPUSD, XAUUSD, NAS100, and USDJPY. The tool aids traders in reading market intent by showing institutional defense or abandonment of price levels, defining precise operating zones to reduce subjectivity, and focusing trading decisions on professional interest areas rather than arbitrary price points.
指标配置
客户评价
4.6
评价:3
5 | 67 % | |
4 | 33 % | |
3 | 0 % | |
2 | 0 % | |
1 | 0 % |
客户评价
January 19, 2026
The best part is random clicks become easier to catch, and a 1R exit plan makes review easier.
January 14, 2026
H1 makes the signal less noisy, and it adds a useful layer without forcing action.
January 5, 2026
No reason to yolo this live without a few normal sessions. The result needs a journal.
讨论
常见问答
BTCUSD
Forex
Signal
Breakout
Indices
EURUSD
Commodities
GBPUSD
NZDUSD
Scalping
Crypto
Stocks
XAUUSD
NAS100
USDJPY
cTrader Store 提供的所有产品,包括交易机器人、指标和插件,均由第三方开发者提供,仅供信息参考和技术访问之用。cTrader Store 并非经纪商,不提供投资建议、个人推荐或任何未来业绩保证。


!["[Stellar Strategies] MARSI Signal Plotter" 标识](https://cdn.ctrader.com/image/webp/7b2b8da6-8f8e-4646-8d4a-4710c516c01e_25567)


价格
注册日期 11/07/2025
3
销售