
Market Bias Dashboard
指标
版本 1.0, Jul 2026
Windows 版、Mac 版
Trading product for Market Bias Dashboard 指标 Premium/Discount  Key Levels, image 2
Trading product for Market Bias Dashboard 指标 Premium/Discount  Key Levels, image 3
Trading product for Market Bias Dashboard 指标 Premium/Discount  Key Levels, image 4

说明

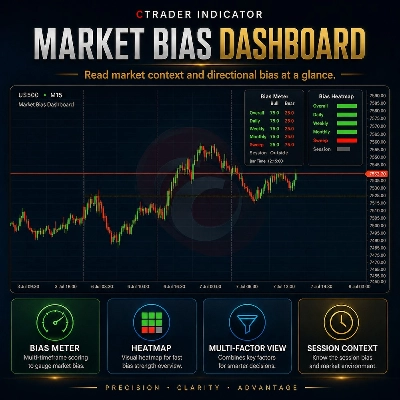
市场偏向仪表板是一个可视化的cTrader指标,旨在直接在您的图表上总结市场背景。


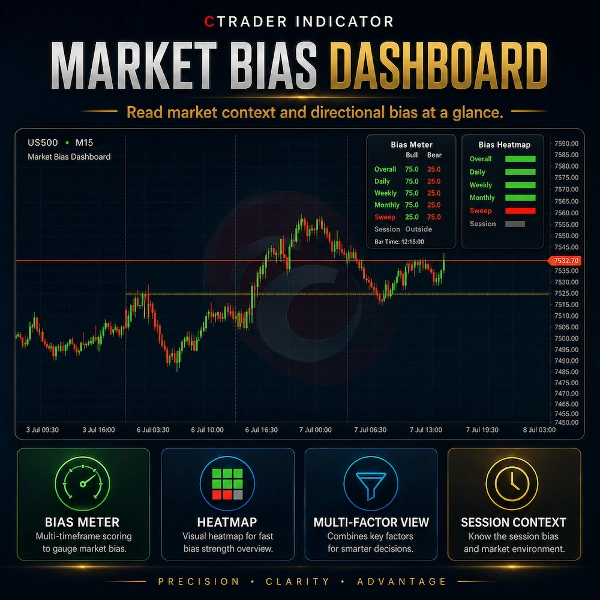
该仪表板评估选定的价格行为参考点,如前一天、前一周和前一月的均衡水平、当前交易时段状态以及最新检测到的流动性扫荡。结果以简洁的偏向计和偏向热图布局显示。


重要提示:显示的多头/空头数值不是统计概率、实时市场情绪数据或交易胜率预测。它们是固定的视觉上下文状态,用于使仪表板更易于阅读。


仪表板使用以下状态逻辑:


看涨背景:75 / 25

中性或混合背景:50 / 50

看跌背景:25 / 75


例如,如果价格高于选定的均衡水平,该组成部分可能显示为看涨背景。如果价格低于该水平,可能显示为看跌背景。如果背景不明确、不可用或混合,可能显示为中性。


主要功能:

- 简洁的偏向计面板

- 偏向热图面板

- 前一天、前一周和前一月的CE背景

- 溢价/折价背景视图

- 当前交易时段状态

- 可选的流动性扫荡背景

- 可选参考线

- 可调节的面板位置

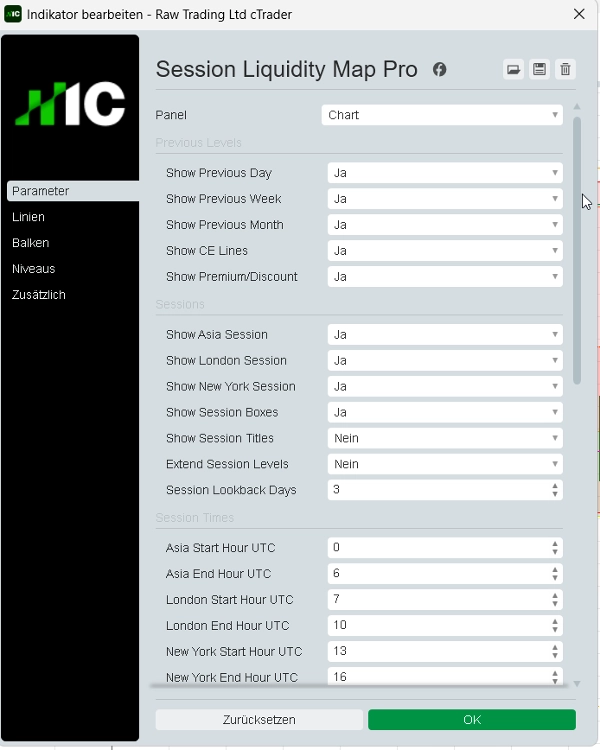
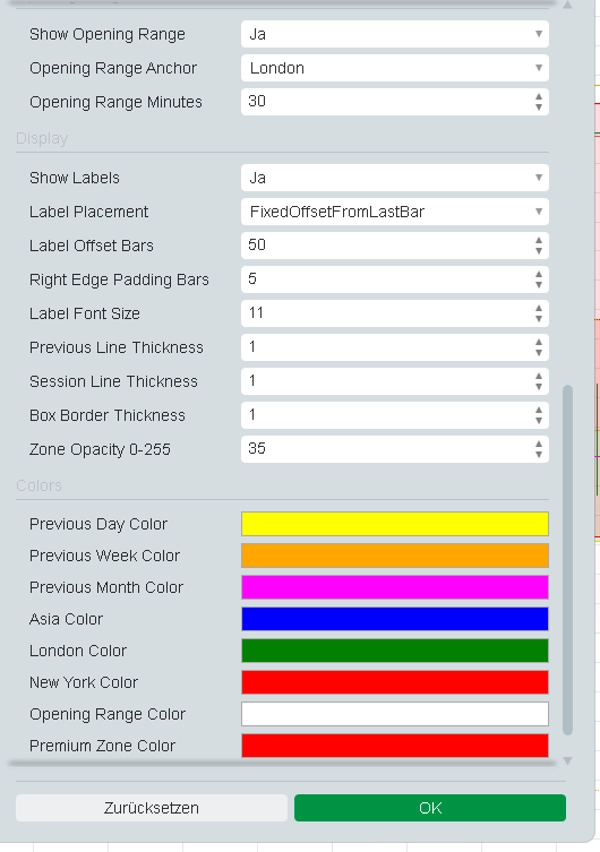
- 自定义颜色和显示设置

- 具有受限访问权限的商店安全指标


市场偏向仪表板仅是图表可视化和市场背景工具。它不执行交易,不修改订单,也不提供保证的买卖信号。


交易涉及风险。该指标不提供财务建议、投资推荐、统计概率或保证的交易结果。

摘要

AI 摘要
Market Bias Dashboard is a cTrader indicator that visually summarizes market context on your chart. It evaluates key price action reference points including previous day, week, and month equilibrium levels, current session status, and recent liquidity sweeps. These elements are presented through a Bias Meter and Bias Heatmap, indicating bullish, bearish, or neutral market states based on price positioning relative to equilibrium levels. The dashboard’s bias states use fixed visual values (bullish: 75/25, neutral: 50/50, bearish: 25/75) to simplify interpretation and do not represent probabilities or trading signals. Features include premium/discount context views, optional liquidity sweep indicators, adjustable panel positioning, customizable colors and display settings, and reference lines. The tool is designed solely for market context visualization and does not execute trades or provide financial advice. It supports analysis of trend strength and reversal signals using bar data and is categorized under trend indicators. Tags associated with the product highlight its focus on structure and smart money concepts such as key levels, liquidity grabs, and risk dashboards.
指标配置
指标分类
趋势
输出类型
可视化
数据要求
仅 K 线
支持的信号
反转
趋势强度

客户评价

0.0
评价:0
客户评价
该产品尚无评价。已经试过了?抢先告诉其他人!

讨论

常见问答

Premium/Discount
Key Levels
Liquidity Sweep
Risk Dashboard
Liquidity Grab
cTrader Store 提供的所有产品,包括交易机器人、指标和插件,均由第三方开发者提供,仅供信息参考和技术访问之用。cTrader Store 并非经纪商,不提供投资建议、个人推荐或任何未来业绩保证。


该作者的其他作品

指标
SMC
Prop
+6
Automatically draws the Opening Range (High & Low) for Tokyo, London, and New York sessions. Configurable start times,
指标
Liquidity Grab
Liquidity Sweep
+2
Visualizes accumulation ranges, manipulation sweeps and distribution phases on your cTrader chart.
指标
BOS
Key Levels
+2
Maps bullish and bearish order block zones, CE levels and structure-based price action context.
指标
MSS
Key Levels
+4
Maps session ranges, previous highs/lows, equilibrium and premium/discount zones on your cTrader chart.
指标
SMC
Prop
+12
Killzone, ICT, SMC, Session, Asia, London, New York, NY PM, Session High, Session Low, Smart Money, Order Flow, Trading
指标
MSS
Key Levels
+2
Maps equal highs, equal lows and active liquidity pools directly on your cTrader chart.
指标
EMA
RSI
+2
Compact premium cTrader dashboard for market bias, sessions, premium/discount context, liquidity direction, ADR range an
指标
BOS
MSS
+3
Maps BOS, CHoCH, swing breaks and market structure shifts directly on your cTrader chart.
指标
SMC
Prop
+12
Shows bullish/bearish bias for 5 timeframes in one panel. Three bias methods, alignment summary, fully configurable.

猜您喜欢

指标
Forex
Crypto
+2
Market Structure Indicator – Your Trading Map in a Noisy Market. No more Panicking Which one, Where, Why and How.
指标
MSS
Key Levels
+2
Maps equal highs, equal lows and active liquidity pools directly on your cTrader chart.
指标
RSI
Forex
+10
Unlock Stochastic RSI PRO in cTrader! Overlay RSI, highlight zones, and identify divergences with customizable settings.
指标
The Weekly Daily Levels indicator shows the OHLC, and mid-point prices for the previous day and week.
指标
Drawdown Monitor
Proprietary trading desk risk monitoring dashboard!
指标
AI
ATR
+25
On-chart draggable panel to show/hide Positions & Pending Orders with fixed warning banner and inline alerts per symbol.
指标
Forex
Crypto
+2
Unique Pyramid Design , Clear Price Action Trend
指标
ATR
Prop
+4
Supertrend Indicator for cTrader
指标
Prop
Forex
+4
Displays real-time balance, equity, P&L, margin metrics directly on your charts.
指标
Market Structure
Stop guessing which trading session you in, with Sessions indicator sessions are in your finger tips like a pro
指标
AI-assisted
Order Block
+5
The daily bias estimator indicator uses ICT concepts to show whether the chart is bullish or bearish on multi-time frame
指标
ATR
Key Levels
It combines the trend-filtering power of Renko charts with the volatility tracking of ATR Bands
指标
Key Levels
Market Structure
+1
Sessions, ICT killzones, multi-ORB and previous levels. One clean, no-repaint cTrader overlay.
指标
News Filter
External Data
+3
Real-time financial news and economic calendar overlay for cTrader with smart alerts
指标
Allow trader to draw multi trendlines in different timeframes on one chart,Give trader an overview of the current market
指标
Prop
Forex
+5
Pivot Point with base zone daily Asia-London-New york Session.
指标
Forex
BTCUSD
+5
Trend analysis, automatic analysis, position, swingtrader, scalper
指标
Forex
EURUSD
+5
Fimathe Indicator - Fimathe PCM - Automated Trend Channels & Levels — Ideal for live trading and backteting

价格
























