present
注册即可在首次购物时获得 $50 优惠
Trading product for Smart Liquidity Matrix 指标 Premium/Discount  Fair Value Gap, image 1
Smart Liquidity Matrix
指标
版本 1.0, Sep 2026
Windows 版、Mac 版
Trading product for Smart Liquidity Matrix 指标 Premium/Discount  Fair Value Gap, image 2
Trading product for Smart Liquidity Matrix 指标 Premium/Discount  Fair Value Gap, image 3
Trading product for Smart Liquidity Matrix 指标 Premium/Discount  Fair Value Gap, image 4
Trading product for Smart Liquidity Matrix 指标 Premium/Discount  Fair Value Gap, image 5
Trading product for Smart Liquidity Matrix 指标 Premium/Discount  Fair Value Gap, image 6
Trading product for Smart Liquidity Matrix 指标 Premium/Discount  Fair Value Gap, image 7
Trading product for Smart Liquidity Matrix 指标 Premium/Discount  Fair Value Gap, image 8
Trading product for Smart Liquidity Matrix 指标 Premium/Discount  Fair Value Gap, image 9
Trading product for Smart Liquidity Matrix 指标 Premium/Discount  Fair Value Gap, image 10
Trading product for Smart Liquidity Matrix 指标 Premium/Discount  Fair Value Gap, image 11

说明

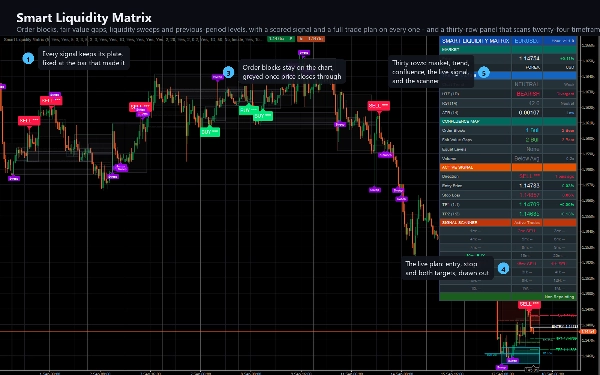
智能流动性矩阵标记机构订单流留下的结构,并保持

在二十四个时间框架中同时对相同设置进行持续读取。


它绘制的内容


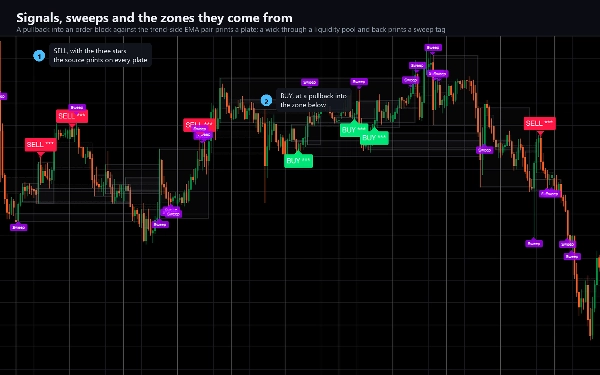
订单区块。在每个确认的波动点,移动前的最后一个相反蜡烛被框选。该区域

保持有效,直到价格收盘穿过它,然后变灰而不是消失,这样你仍然可以

看到它的位置。


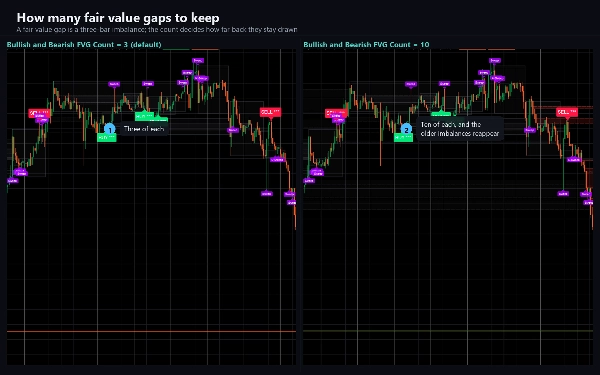
公平价值缺口。三根柱的不平衡,在形成时绘制,价格收盘穿过时变灰。


相等的高点和低点。波动点在当前ATR的十分之一范围内匹配,用虚线连接,

并标记为EQH或EQL。这些是流动性扫荡所追踪的池。


流动性扫荡。当价格穿过相等水平或前一周期的高点或低点并收盘回内时,

该柱被标记。每次扫荡都可以触发警报。


前一周期的水平和均衡。前一天的高点和低点,用独特的光晕绘制,

以及当前波动高低点之间的五十个百分点线。


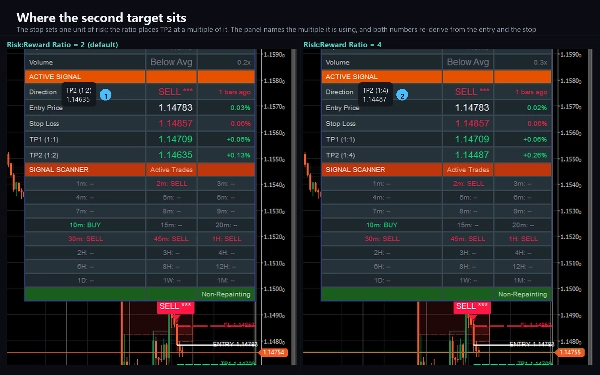
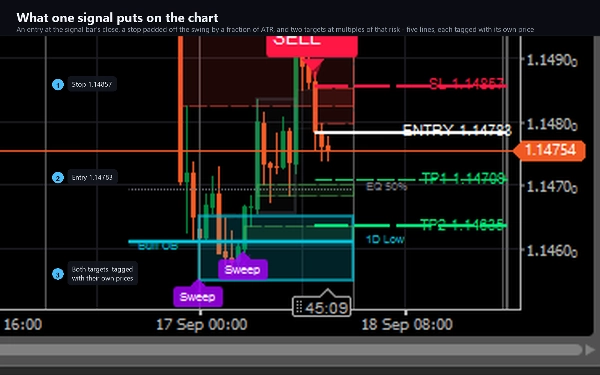
带有风险图的买卖信号。针对趋势侧EMA对的回调入场,入场点、止损和两个目标

绘制在柱右侧,并标注价格。


扫描器


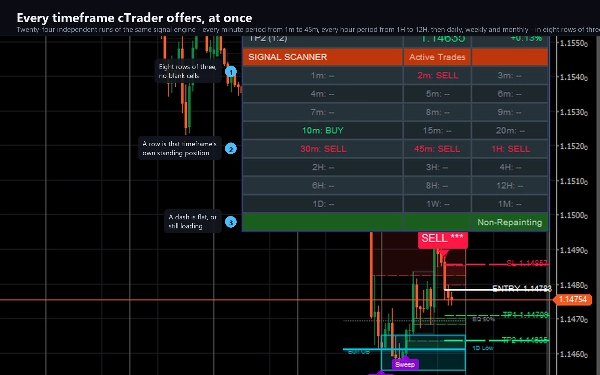
仪表盘的下三分之一部分独立运行二十四个时间框架的相同信号逻辑,

从一分钟到一个月,并显示每个时间框架当前持有多头、空头或无信号。邻近行之间的

一致性是关键:三十分钟、四十五分钟和一小时同时显示卖出信号,与单行的孤立信号

含义截然不同。


这二十四个时间段涵盖cTrader提供的所有标准周期:一、二、三、四、五、六、

七、八、九、十、十五、二十、三十和四十五分钟,然后是一、二、三、四、

六、八和十二小时,接着是日线、周线和月线。所有时间框架均基于与图表相同的柱数据读取,

因此不依赖于您的经纪商的报价历史,且它们正好填满八行三列,无空单元格。


仪表盘


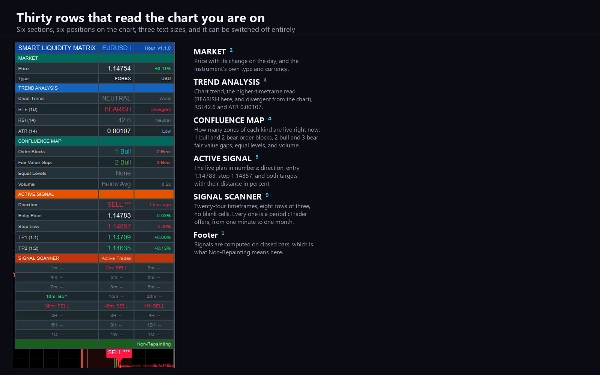
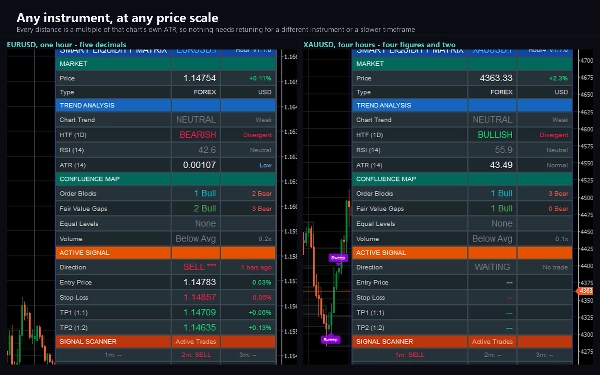
三十行分为六个部分:市场、趋势分析、汇聚图、活跃信号、扫描器和页脚。六个位置,三种文本大小,且可完全关闭。行间距针对cTrader图表窗格进行了调整,通常比浏览器图表更短。


警报与自动化


信号、结构事件和扫荡的日志、声音和电子邮件警报,去重处理确保每根柱只触发一条消息。内置Webhook通过cTrader自有网络服务将相同事件以JSON格式发送到您选择的任何地址,方便机器人或日志记录程序响应。未输入地址前保持关闭,指标加载历史时不触发,回测时不触发,并有限速控制。


该指标不请求提升权限。无法读取您的文件或启动进程。


设置


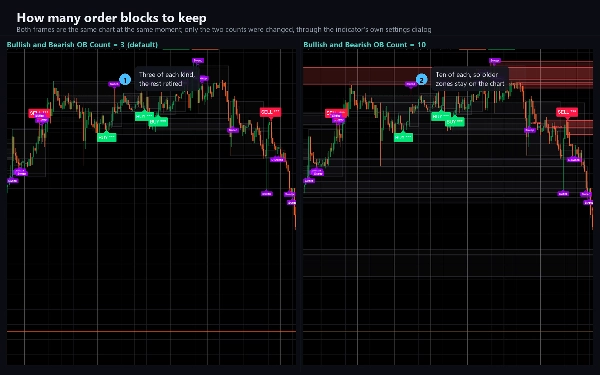
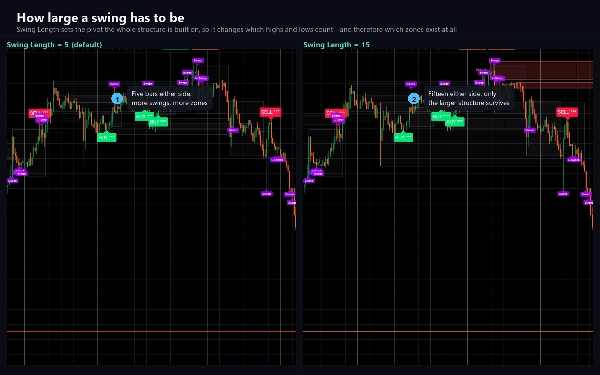
十六组共七十个参数。每个区域的数量、颜色、时间框架和标签位置均可调节,且有简洁模式可使每条线条更清晰。


适用范围


外汇、指数、金属和加密货币差价合约。任何时间框架;默认设置基于一小时。扫描器部分在五分钟到四小时之间最具信息量。


它不做的事


它不下单、不修改订单也不平仓。它是分析和警报工具。信号仅在收盘柱上计算且不重绘。


交易有风险。过去的表现不保证未来结果。

摘要

AI 摘要
Smart Liquidity Matrix is a market structure indicator designed for use on cTrader charts, supporting Forex, indices, metals, and crypto CFDs across all timeframes. It identifies and visually marks key institutional order flow features such as order blocks, fair value gaps, equal highs and lows, liquidity sweeps, and previous period levels. Order blocks highlight the last opposite candle before confirmed swings, while fair value gaps show three-bar imbalances. Equal highs and lows are connected to indicate liquidity pools targeted by sweeps, which are marked when price wicks beyond these levels but closes back inside. The indicator also displays buy and sell signals with entry, stop, and target levels based on trend-side EMA pullbacks.

A unique feature is its 24-timeframe signal scanner, which independently analyzes from one minute to monthly intervals, showing long, short, or neutral signals to identify multi-timeframe agreement. The dashboard organizes information into six sections including market data, trend analysis, confluence, active signals, and the scanner, optimized for cTrader’s chart pane.

Alerts can be configured for signals, structure events, and sweeps, with options for log, sound, email, and webhook notifications for automation or journaling. The indicator uses closed bars only and does not repaint. It offers extensive customization with seventy adjustable parameters and a Lite Mode for cleaner visuals. It does not execute trades but serves as an analytical and alerting tool.
指标配置
指标分类
市场结构(SMC)
输出类型
信号
数据要求
仅 K 线
支持的信号
突破
反转
触及水平位
突破水平位

客户评价

0.0
评价:0
客户评价
该产品尚无评价。已经试过了?抢先告诉其他人!

讨论

常见问答

Premium/Discount
Fair Value Gap
Key Levels
Liquidity Sweep
Order Block
Market Structure
Liquidity Grab
cTrader Store 提供的所有产品,包括交易机器人、指标和插件,均由第三方开发者提供,仅供信息参考和技术访问之用。cTrader Store 并非经纪商,不提供投资建议、个人推荐或任何未来业绩保证。

该作者的其他作品

指标
ATR
CCI
+4
A trend line that never steps back, a shaded band to the price, and a pointer at the swing where the trend turns.
指标
ADX
ATR
+5
SuperTrend signals scored on five confluence factors, with an ATR stop, three targets and a dashboard.
指标
ADX
ATR
+5
Ten confluence layers scored on every closed bar, with an anti-chop gate, pivot levels and a live dashboard.
指标
ATR
RSI
+4
RSI bands drawn on price, confluence-scored BUY/SELL signals, an ATR stop with three targets
指标
Volume
Channel
+3
A higher-timeframe log-regression channel with a volume profile, Point of Control and session levels.
指标
Volume
Key Levels
+1
Fixed-grid volume profile: bull and bear volume at every price level, with Point of Control and value area.
指标
ATR
BOS
+5
Know how strong each Supertrend flip is: scored BUY/SELL, structure stop + 3 targets, live win-rate dashboard, alerts.
指标
ATR
EMA
+3
EMA trend, RSI reclaim and divergence signals with ATR stop and two targets, swing levels and a 16-row dashboard.
指标
ATR
EMA
+2
Eight-EMA ribbon with ATR trade zones, a nine-symbol screener and a five-timeframe trend dashboard.
指标
ADX
ATR
+5
EMA-cross signals scored on six confluence layers, with an ATR stop, three targets and a live panel
指标
ADX
ATR
+5
Range-filter BUY/SELL flips with an ATR or swing stop, three targets, five confluence stars and a live panel
指标
ATR
EMA
+4
Range-filter BUY/SELL signals scored by four confluence layers, with a stop, five targets and a trend panel

猜您喜欢

指标
BOS
Key Levels
+1
Guided by Yahuah Yahusha. 15M: BOS above red (buys)/below green (sells). 4HC reject+BOS. 5M: RBS/SBR. SL wick. TP 1:4.
指标
Forex
BTCUSD
+4
This indicator is designed to perform multiple non-linear regression analysis using four independent variables.
指标
EMA
Supertrend
+4
Dynamic dual MA cloud indicator. Identifies trends, crossovers, and pullback entries in real time for any asset.
指标
Forex
GBPUSD
+3
Support & resistance zones with measured hold rates and confidence intervals — evidence, not just lines on a chart.
指标
Forex
EURUSD
+3
ATR-normalized MA slope in degrees, comparable across all instruments. Color-coded labels flag strong trend moves.
指标
Key Levels
Support & Resistance
Clean psychological round-number grid with native pip and point auto-scaling across Forex, Gold, Indices, and Crypto.
指标
Candle Timer & Strength Panel for cTrader Description: Candle Timer & Strength Panel is an advanced, always-visible over
指标
EURUSD
GBPUSD
+3
All-in-one suite for ICT concepts: NY Midnight Open, Killzones, automatic Liquidity levels (PDH/L, PWH/L).
指标
Forex
Crypto
+4
Spot powerful 3-candle reversal patterns like Morning/Evening Star and Soldiers/Crows at key swing highs and lows
指标
ATR
Key Levels
+1
See both sides of the trade before you take either one.
指标
CHOCH
Key Levels
+4
Real-time compliance dashboard for prop firm challenges. Tracks daily loss, max drawdown, and profit target.
指标
Supertrend
Adaptive MA anchored to structural trend changes — no fixed period. Dual Supertrend + swing detection.
指标
Key Levels
Order Block
+5
Pixel-perfect trading zones in a click! Instantly draw, resize & color via hotkeys. Automate your charting routine
指标
Breakout
Allow trader to visualize Support & Resistance across different timeframes,give trader an overview of the current market
指标
EMA
RSI
+5
Keep your focus with smart on-chart notes. Features Markdown, 6 themes, and auto-save per symbol for manual trading.When
指标
Auto Fibonacci Retracement Indicator for cTrader
指标
Area of Interest with the power of AI to detect the market interest.
指标
Prop
Forex
+11
🧭 See when your market tends to move—by Month, Day-of-Week, or Hour-of-Day🧭

价格

3
销售