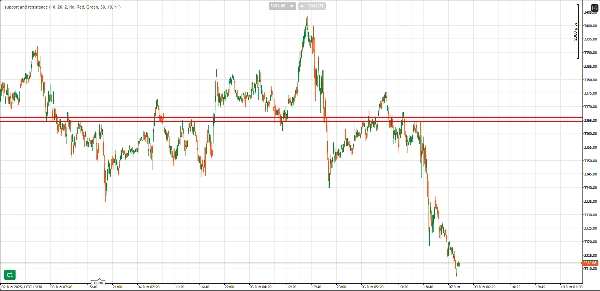
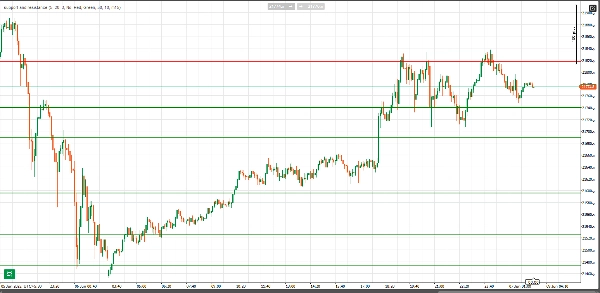
经纪商和自营
面向企业
00
Days
:
00
Hours
:
00
Minutes
:
00
Seconds
指标
NAS100
NZDUSD
Breakout
XAUUSD
Forex
EURUSD
GBPUSD
BTCUSD
USDJPY
support and resistance
07/12/2025
6
Desktop
注册日期 30/05/2025
销售
17
"support and resistance" 已上传图片"support and resistance" 已上传图片

Key Features:

  • Automatic Detection of Support and Resistance: The indicator automatically identifies significant support and resistance levels based on price action, highlighting these zones where the price has reversed or stalled multiple times.
  • Bounce Count Validation: Support and resistance levels are validated based on the number of bounces (price reactions) from the level. The more bounces, the stronger the level. You can adjust the minimum bounce count for a level to be considered valid, ensuring that only highly significant levels are marked.
  • Adjustable Line Styles: The thickness and style of support and resistance lines are automatically adjusted based on the bounce count. Levels with more bounces are drawn with thicker, more prominent lines, visually emphasizing their importance.
  • Zone Width (Pips): You can define a buffer zone around support and resistance levels in pips. This helps in identifying price action within a range where the price could potentially reverse or react.
  • Higher Timeframe Filter: A unique feature of this indicator is its ability to validate support and resistance levels using a higher timeframe filter. By selecting a higher timeframe (e.g., 1H, 4H), the indicator cross-checks the identified levels against key price action on the higher timeframe, ensuring that only significant levels are drawn on the chart.
  • Alerts: When price enters the zone of a support or resistance level, the indicator can alert you with an audio sound, so you never miss an important price reaction.
  • Customizable Colors: You can easily change the color of support and resistance lines to suit your preferences or align with your trading theme.
  • Overlap Prevention: The indicator includes a threshold filter that prevents drawing overlapping support and resistance levels that are too close to each other, ensuring that only unique and important levels are displayed.

Benefits:

  • Save Time: Automatically detect and visualize key support and resistance levels without manually drawing them.
  • Clear Visuals: Easily see which support and resistance levels are the most significant based on price bounces and higher timeframe validation.
  • Effective Alerts: Receive timely alerts when price action enters important levels, helping you to act quickly and efficiently.
  • Improved Trading Decisions: Use this indicator to gain more confidence in your entries and exits, as well as your overall technical analysis.

Customization Options:

  • Lookback Bars: Adjust how far back the indicator looks to identify potential support and resistance levels.
  • Minimum Bounces: Set the minimum number of bounces required for a level to be considered valid.
  • Higher Timeframe: Filter support and resistance levels based on a higher timeframe (e.g., 1-hour, 4-hour charts).
  • Line Color: Choose colors for resistance and support lines to suit your chart style.
  • Alert Settings: Enable or disable alerts based on price entering support or resistance zones.
0.0
评价:0
客户评价
该产品尚无评价。已经试过了?抢先告诉其他人!
该作者的其他作品
指标
NAS100
Indices
Prop
+3
session indicator
📈 Trading Sessions Indicator — London, New York & Tokyo Visualize Key Market Sessions + High/Low Levels with Precision
指标
ATR
Supertrend
supertrend
Supertrend Indicator for cTrader
指标
Breakout
Forex
Pivot Point Daily Indicator
Pivot Points Standard — All-in-One Multi-Timeframe Pivot Indicator for cTrader
猜您喜欢
指标
Indices
Prop
Stocks
+5
New Way Sar - Free
The Parabolic SAR, or "Stop and Reverse," is a dynamic technical analysis tool
Drawing Utility
A rectangular box with 5 adjustable Fibonacci level or even custom ones.
SupertrendHTF
Overlay higher-timeframe SuperTrend to filter noise, follow real trends, and avoid lower-timeframe whipsaws. As
DMI MONDAY ZONES v2.1
Marks Monday's OPEN,HIGH & LOW. These are areas of support and resistance for the week.
TraderMaxBBFilterX
TraderMax BB Filter X (FULL) for cTrader 📈 A premium signal tool based on Bollinger Bands + Trend Filter Designed for
Rsi Scalp Indi
RSI Scalper delivers split‑second entries on volatile assets.
指标
NAS100
NZDUSD
Martingale
+26
Kalman Filter Trend
Smarter trend detection with zero unnecessary lag.
指标
NZDUSD
Forex
EURUSD
+2
4 RCS Relative Strength w Alerts_NSC
Forex Strength Meter for cTrader: 4 custom currencies, cross alerts, visual arrows. Trade smarter!
指标
NAS100
XAUUSD
Breakout
+10
VWAPSigmaBandPRO_Max
Professional VWAP + Sigma Bands. Auto signals, 3 modes, live stats, multi-level entry/exit. Proven volume-based system.
VegaXLR - RSI and StochRSI Alerts
VegaXLR's cTrader StochRSI identifies overbought/oversold RSI levels for precise trade entries.
指标
Indices
Forex
Crypto
Super Arrows
Super Arrows
指标
NAS100
NZDUSD
XAUUSD
+12
Cosmic Decision System Pro
Decision System Indicator According to Cosmic Laws
Wstęgi DoubleSMMA
Wstęgi HTS
Volume Edge Pro
Pro Volume Profile with Delta, Session Filters & CSV Export. Precision order flow analysis.
指标
VWAP
ZigZag
Weis & Wyckoff System v2.0
指标
NAS100
NZDUSD
XAUUSD
+12
Fair Value Gap Pro
Institutional FVG detection with HTF projection, precise volume deltas, and smart fill logic.
指标
Indices
RSI
Breakout
+9
Advanced HTF Trend Buy & Sell Trading System
Detects breakouts 📈 auto-draws levels 🚀 confirms trends 🐻 dynamic signals 🎨 customizable for any asset & timeframe.
指标
Grid
RSI
XAUUSD
+14
Trend Entropy pro
Entropy is the scientific measure of disorder or uncertainty in a system