
说明
主要特点:
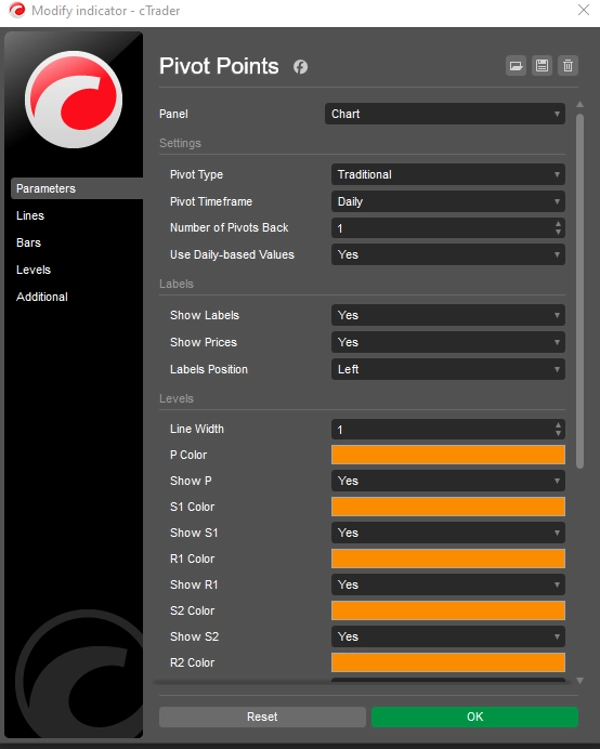
- 多种枢轴样式:无缝切换六种枢轴计算方法:经典、斐波那契、伍迪、卡玛里拉、DM 和传统。每种方法支持不同级别(传统和卡玛里拉最高至 R5/S5,斐波那契至 R3/S3,DM 至 P/R1/S1)。
- 灵活的时间框架:可选择多种枢轴时间框架,包括自动、每日、每周、每月、每季度、每年及多年度选项(两年、三年、五年、十年)。完美匹配您的交易周期。
- 历史枢轴控制:通过“向后枢轴数量”参数设置显示的历史枢轴组数(1–200),确保图表整洁同时保留关键历史水平。
- 可定制外观:颜色、线宽和标签设置均可完全调整。可开关标签和价格值,并选择标签位置(左侧或右侧),配合智能垂直偏移以提高清晰度。
- 每日或日内数据:可选择使用基于每日的数值或图表时间框架数据,满足不同交易策略的灵活需求。
- 优化性能:轻量级原生 cTrader 代码,确保快速实时更新无延迟,兼容外汇、指数、商品、加密货币等多种市场。
为什么选择 Pivot Points Standard?
- 多功能交易工具:识别关键支撑/阻力位、趋势方向和突破机会,适用于任何市场或时间框架。
- 用户友好界面:直观的下拉菜单选择枢轴类型、时间框架和标签位置,轻松定制。
- 历史分析:可视化多达 200 组历史枢轴,研究过去价格互动,优化交易策略。
- 清晰图表:智能标签定位和可定制线长避免图表杂乱,提升可读性。
使用方法:
- 将指标应用到您的 cTrader 图表。
- 选择您偏好的枢轴类型(例如斐波那契、卡玛里拉)和枢轴时间框架(例如每日、每月)。
- 调整“向后枢轴数量”以控制显示的历史组数。
- 自定义颜色、线宽和标签设置,符合您的风格。
- 利用枢轴水平识别支撑/阻力,设置止损/止盈,或进行突破交易。
适用对象:
- 日内交易者:利用每日或每周枢轴进行日内进出场操作。
- 波段交易者:使用每月或每季度枢轴捕捉中长期趋势。
- 剥头皮交易者:结合更低时间框架实现快速精准交易。
- 所有市场:无缝适用于外汇、股票、加密货币和商品市场。
提升您的交易信心
通过 Pivot Points Standard,您将获得一款强大的一体化工具,简化技术分析,增强发现高概率交易机会的能力。无论您是初学者还是资深交易者,该指标都能适应您的策略,提供清晰、可操作的水平,提升您的交易水平。立即试用 Pivot Points Standard,精准清晰地掌控您的交易!一次性付款,终身使用,包含未来更新。
摘要
AI 摘要
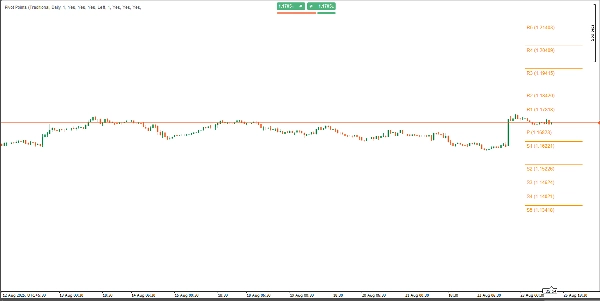
Pivot Point Daily Indicator is a multi-timeframe pivot point tool designed for the cTrader platform. It supports six pivot calculation methods—Classic, Fibonacci, Woodie, Camarilla, DM, and Traditional—each offering various resistance and support levels (up to R5/S5 for some methods). Users can select from a broad range of timeframes including Auto, Daily, Weekly, Monthly, Quarterly, Yearly, and multi-year intervals, allowing alignment with different trading horizons.
The indicator allows displaying up to 200 historical pivot sets to analyze past price interactions while maintaining chart clarity through customizable label positions and line settings. It offers options to use daily-based or intraday data, enhancing flexibility for diverse trading strategies.
Pivot Point Daily Indicator is optimized for real-time performance with native cTrader coding, compatible across Forex, indices, commodities, cryptocurrencies, and other markets. Its interface includes intuitive dropdown menus for pivot type, timeframe, and label customization.
Traders can use this indicator to identify key support and resistance levels, trend directions, and breakout opportunities, aiding in setting stop-loss and take-profit points. It suits various trading styles including day trading, swing trading, and scalping across multiple asset classes.
指标配置
指标分类
支撑与阻力
输出类型
过滤器
数据要求
仅 K 线
支持的信号
突破水平位
客户评价
4.2
评价:4
5 | 25 % | |
4 | 75 % | |
3 | 0 % | |
2 | 0 % | |
1 | 0 % |
客户评价
May 2, 2026
Bought it, added it, used it for a while, and now it's disappeared, and I cannot get it back!
August 28, 2025
Good helper for review if the trader wants it keeps attention on levels that actually matter. It works best as support, not a final decision maker. The cleanest use is 3 to 5 levels per chart, with 0.5 pullbacks checked before entry. not every zone holds, even if it looks clean.
August 27, 2025
August 27, 2025
Usable tool with purpose for traders who build plans around market levels. It gives value around key price zones, but not every zone holds, even if it looks clean. I would wait for 2 reactions and avoid trades where the target is less than 1.5R. Levels are useful when they reduce noise, not when they crowd the chart.
讨论
常见问答
Fibonacci
Prop
Forex
Breakout
Indices
Commodities
cTrader Store 提供的所有产品,包括交易机器人、指标和插件,均由第三方开发者提供,仅供信息参考和技术访问之用。cTrader Store 并非经纪商,不提供投资建议、个人推荐或任何未来业绩保证。


猜您喜欢


!["Smart Money Concepts (SMC) [Iridio Capital]" 标识](https://cdn.ctrader.com/image/webp/28b69fd1-ef54-4bed-9487-07e78e883be4_40934)


价格
注册日期 30/05/2025
40
销售