
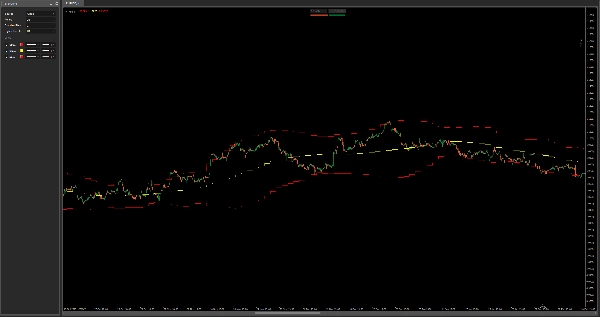
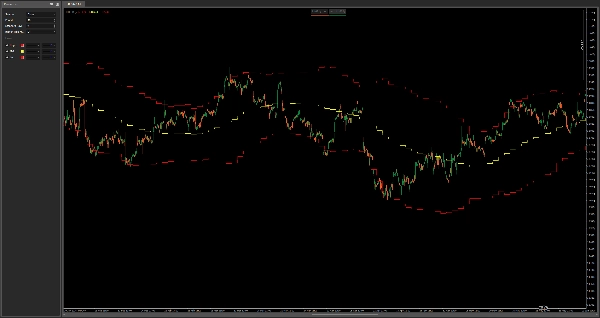
HTF 布林带 – 多时间框架波动率图
该指标将 较高时间框架的布林带 绘制到您当前的图表上,为您提供关于波动率、均值回归和动态支撑/阻力的强大背景——无需切换时间框架。
功能:
- 显示来自任何可选较高时间框架的上轨、中轨和下轨布林带
- 非常适合识别 高时间框架盘整区、突破压力 和 趋势回调
- 非常适合结合较高时间框架意识进行剥头皮和日内入场
- 适用于所有资产和时间框架
结合您当前的策略,避免交易陷入波动陷阱,并保持与宏观价格结构的一致。
指标配置
5.0
评价:1
5 | 100 % | |
4 | 0 % | |
3 | 0 % | |
2 | 0 % | |
1 | 0 % |
客户评价
July 29, 2025
confusing signals get easier to ignore, but a clean signal can still fail.
cTrader Store 提供的所有产品,包括交易机器人、指标和插件,均由第三方开发者提供,仅供信息参考和技术访问之用。cTrader Store 并非经纪商,不提供投资建议、个人推荐或任何未来业绩保证。


!["[Hamster-Coder] Bollinger Bands" 标识](https://cdn.ctrader.com/image/webp/21d8e5d6-fb11-4bac-b9ee-cd05c2b76804_30327)


注册日期 03/01/2025
638.03K
交易量
21.34K
盈利点数
15
销售