
SwingHighLow
指标
10 购买
版本 1.0, Jul 2025
Windows 版、Mac 版
4.3
评价:3
说明
cTrader的高低摆动指标
像专业人士一样绘制市场结构。
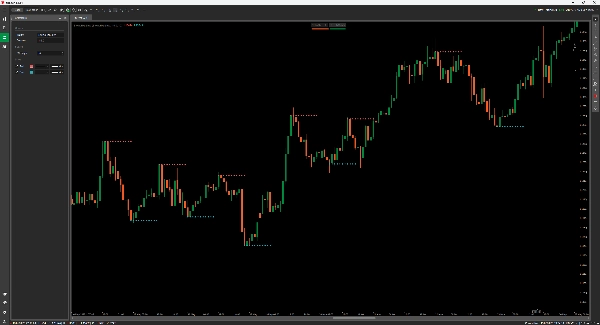
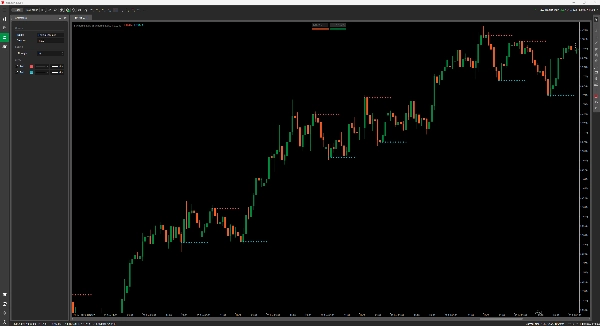
此高低摆动指标会自动检测并绘制图表上的重要转折点——非常适合依赖价格行为、结构和支撑/阻力区域的交易者。
功能:
- 突出显示 确认的摆动高点(红色)和 摆动低点(蓝色),并以清晰的点状标记显示。
- 可调节的 强度参数让您过滤噪音或收紧信号。
- 适用于趋势分析、反转识别和突破陷阱。
适用于所有时间框架。无重绘。仅显示清晰标记的坚实市场结构。
摘要
AI 摘要
The SwingHighLow indicator for cTrader automatically detects and plots significant swing highs and lows on price charts, aiding traders in identifying market structure, price reversals, and support/resistance zones. It highlights confirmed swing highs in red and swing lows in blue with clear point markers. The indicator includes an adjustable strength parameter that allows users to filter market noise or tighten signal sensitivity according to their trading preferences. It is suitable for use across all timeframes and supports analysis for various markets including Forex, indices, commodities, stocks, and cryptocurrencies such as BTCUSD, EURUSD, and XAUUSD. The tool is designed to assist with trend analysis, spotting reversals, and identifying breakout traps without repainting, providing consistent and reliable market structure visualization.
指标配置
客户评价
4.3
评价:3
5 | 67 % | |
4 | 0 % | |
3 | 33 % | |
2 | 0 % | |
1 | 0 % |
客户评价
July 22, 2025
Good support for rules for swing point analysis. it helps identify turning points and cleaner structure, especially when used for reviewing reversals, pullbacks and swing zones. Swing points look better after 3 pivots, especially when the 0.5 Fib area agrees with structure. The level is useful when it supports the market story.
July 21, 2025
July 21, 2025
Practical choice for demo for a more controlled workflow. It helps with reviewing reversals, pullbacks and swing zones, but the signal still needs broader context. Swing points look better after 3 pivots, especially when the 0.5 Fib area agrees with structure. I would still keep manual review in the process.
讨论
常见问答
BTCUSD
Forex
Signal
Breakout
Indices
EURUSD
Supertrend
Commodities
Stocks
XAUUSD
ATR
cTrader Store 提供的所有产品,包括交易机器人、指标和插件,均由第三方开发者提供,仅供信息参考和技术访问之用。cTrader Store 并非经纪商,不提供投资建议、个人推荐或任何未来业绩保证。


猜您喜欢


!["[Stellar Strategies] Inside Bar with Signals" 标识](https://cdn.ctrader.com/image/webp/1d9e8bfa-3b2c-4440-bb37-5856902008a7_30683)


价格
注册日期 03/01/2025
638.03K
交易量
21.34K
盈利点数
15
销售