
cTrader 的 VixFix 指标
在新闻爆发前捕捉市场恐慌。
这个 VixFix 指标是 Larry Williams 经典“VIX Fix”概念的智能改编——旨在帮助交易者检测短期恐惧和波动性激增,特别有助于识别 潜在的市场底部。
工作原理
- 通过将近期低点与可配置周期内的最高高点(默认:12)进行比较,计算伪波动性激增。
- 应用移动平均和标准差包络线,将 信号激增 与正常噪声区分开来。
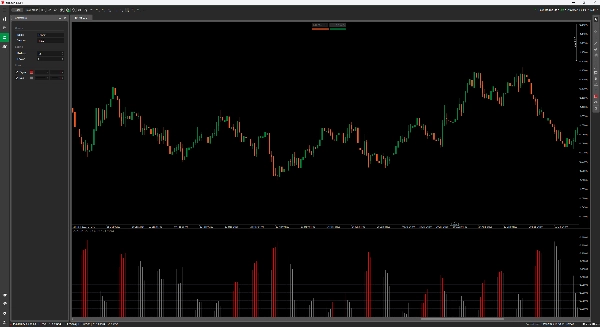
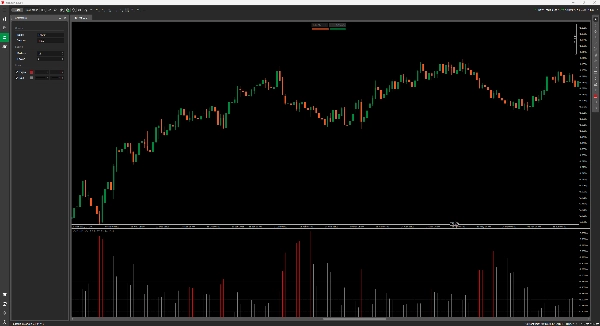
- 当波动性超过阈值时绘制 红色柱状图——这是你开始关注的信号。
特点
- 干净的柱状图显示(非叠加)
- 双色绘图:
-
- 红色 = 信号(波动性激增超过阈值)
- 灰色 = 正常活动
- 可调节的 周期 和 灵敏度因子
- 零指标延迟——仅使用原始价格动作,无重绘
使用案例
- 识别下跌趋势中的 潜在反转
- 时机 均值回归交易
- 确认 超卖状态,无需依赖 RSI 或其他滞后工具
指标配置
4.0
评价:1
5 | 0 % | |
4 | 100 % | |
3 | 0 % | |
2 | 0 % | |
1 | 0 % |
cTrader Store 提供的所有产品,包括交易机器人、指标和插件,均由第三方开发者提供,仅供信息参考和技术访问之用。cTrader Store 并非经纪商,不提供投资建议、个人推荐或任何未来业绩保证。


!["[Stellar Strategies] Inside Bar with Signals" 标识](https://cdn.ctrader.com/image/webp/1d9e8bfa-3b2c-4440-bb37-5856902008a7_30683)


注册日期 03/01/2025
638.03K
交易量
21.34K
盈利点数
15
销售