
Market_Session_Forex
Индикатор
4 покупки
Версия 1.0, Jul 2025
Windows, Mac
4.5
Отзывы: 2
Описание
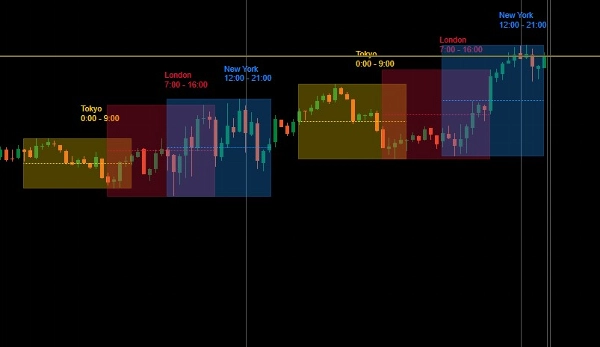
Рынок Forex работает круглосуточно благодаря перекрывающимся глобальным торговым сессиям. Каждая сессия отражает активность основных финансовых центров и характеризуется разным уровнем ликвидности, волатильности и объема торгов.
📊 График отображает три основные сессии в согласованных временных блоках:
🟡 Токийская сессия (Азиатская сессия)
🔴 Лондонская сессия (Европейская сессия)
🔵 Нью-Йоркская сессия (Сессия США)
🧩 Периоды перекрытия:
- Перекрытие Лондон–Нью-Йорк
Самый активный период торгового дня с пиковым объемом и крупными ценовыми движениями.
Мои другие продукты
- Institutional FVG Zones MTF with Confluence
- All-in-One Session Levels Suite
- MARKET_STRUCTURE BOS_CHoCH
- Multi_TF Candlestick Chart Overlay
- ICT Killzones & Macros
- ICT_SMC_ToolKit
- VWAP_MTF
- Traders Dynamic Index (TDI)
- Market_Session_Forex
Сводка
ИИ-сводка
Market_Session_Forex is an indicator designed for forex trading that visually delineates the three primary global trading sessions on a chart: the Tokyo (Asian) session, the London (European) session, and the New York (U.S.) session. Each session is displayed in coordinated time blocks, highlighting periods of varying liquidity, volatility, and trading volume. The indicator also marks the London–New York overlap, recognized as the most active trading period with peak volume and significant price movements. This tool aids traders in identifying key market activity windows aligned with major financial centers, facilitating more informed trading decisions based on session timing.
Профиль индикатора
Отзывы покупателей
4.5
Отзывы: 2
5 | 50 % | |
4 | 50 % | |
3 | 0 % | |
2 | 0 % | |
1 | 0 % |
Отзывы покупателей
August 7, 2025
July 31, 2025
ngl, weak ideas are easier to skip and that is enough to keep testing it. It is one check, not the full trade.
Обсуждение
Частые вопросы
Продукты, доступные в cTrader Store, включая торговых ботов, индикаторы и плагины, предоставляются сторонними разработчиками и доступны исключительно в информационных и технических целях. cTrader Store не является брокером и не предоставляет инвестиционные консультации, персональные рекомендации или какие-либо гарантии будущей доходности.


Цена
С 22/06/2025
83
Продажи
89
Бесплатные установки