
FVG_tidypips
Индикатор
13 покупки
Версия 1.0, Nov 2024
Windows, Mac
4.3
Отзывы: 3

Описание
Этот индикатор Fair Value Gap (FVG) является инструментом технического анализа, который помогает трейдерам выявлять дисбалансы цен.
Особенности:
- Переключение видимости бычьих и/или медвежьих гэпов
- Отображение цветных блоков для удобной визуализации (по умолчанию: зелёный для бычьих, красный для медвежьих, золотой для уровней середины)
- Регулируемый период обратного просмотра для уменьшения загромождения графика
- Настраиваемое расширение блока (смещение) для лучшей визуализации
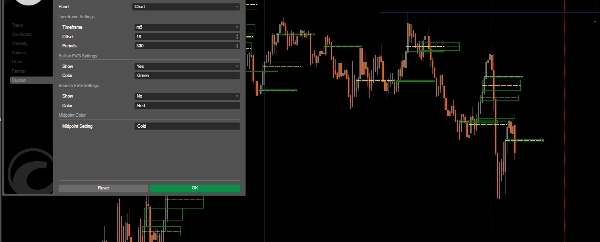
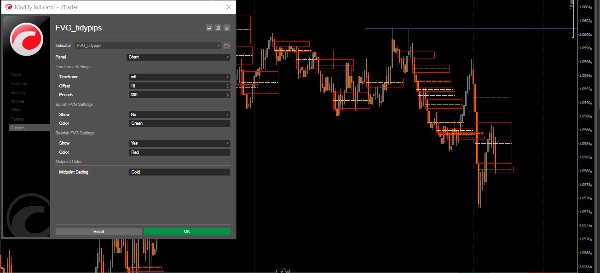
Параметры:
- Таймфрейм: Выберите предпочитаемый таймфрейм для отображения FVG
- Смещение: Регулируйте горизонтальное расширение блоков FVG (3-500)
- Периоды: Установите период обратного просмотра для расчёта исторических FVG
- Показывать бычьи/медвежьи FVG
- Цвета: Настройте цвета для бычьих FVG, медвежьих FVG и линий середины
Применение в торговле:
- Поддержка и сопротивление: FVG часто выступают в роли сильных уровней поддержки/сопротивления
- Ценовые магниты: Незаполненные гэпы склонны притягивать ценовое движение (DOL)
- Структура рынка: Помогают выявлять потенциальные зоны разворота и точки продолжения интереса
- Анализ ордер-блоков: Обнаружение институциональных торговых зон
Лучшие практики применения:
- Используйте в сочетании с другими инструментами технического анализа.
- Более высокие таймфреймы дают более значимые FVG, низкие таймфреймы FVG используются с направленным уклоном более высокого таймфрейма
- Следите за реакцией цены при возврате в зоны FVG
- Обратите внимание на линию середины, так как она часто служит ценовым магнитом
Ознакомьтесь с другими полезными индикаторами, которые я опубликовал. Если вы считаете этот или любой из моих других индикаторов полезным, рассмотрите возможность поддержки моей работы покупкой или пожертвованием. Ваша поддержка не только помогает мне продолжать разработку и улучшение этих инструментов, но и обеспечивает возможность создавать новые, ценные индикаторы для улучшения вашего торгового опыта. Спасибо за вашу постоянную поддержку!
https://buymeacoffee.com/tidypips
Сводка
ИИ-сводка
The FVG_tidypips indicator is a technical analysis tool designed to identify Fair Value Gaps (FVGs), which represent price imbalances on trading charts. It visually highlights bullish and bearish gaps using color-coded boxes—green for bullish, red for bearish, and gold for midpoint levels—facilitating quick recognition of potential support and resistance zones. Users can toggle the visibility of bullish and/or bearish gaps, adjust the lookback period to manage chart clutter, and configure the horizontal extension (offset) of the FVG boxes for clearer visualization.
Key parameters include selecting the timeframe for FVG display, setting the offset range (3–500), defining the lookback period for historical gap calculation, and customizing colors for different gap types and midpoint lines. The indicator supports trading applications such as identifying strong support/resistance levels, spotting price magnets where unfilled gaps attract price action, analyzing market structure for potential reversal or continuation zones, and detecting institutional order block areas.
Best practices recommend using this indicator alongside other technical tools, focusing on higher timeframes for more significant FVGs, and monitoring price reactions when revisiting FVG zones. The midpoint line is noted as an important price magnet. This tool is applicable across various markets, including commodities like gold (XAUUSD).
Профиль индикатора
Отзывы покупателей
4.3
Отзывы: 3
5 | 33 % | |
4 | 67 % | |
3 | 0 % | |
2 | 0 % | |
1 | 0 % |
Отзывы покупателей
November 22, 2024
Good idea with limits for traders who use ICT or SMC concepts. It gives value around smart money style analysis, but zones still need manual validation. A good sample is 20 FVG or order block reactions, with messy 0.705 areas skipped. The zone is more convincing when structure and risk both make sense.
November 21, 2024
November 21, 2024
Small but practical edge for smart money style analysis. it adds structure around liquidity, gaps and market shifts, especially when used for mapping zones before entries. For SMC logic, I trust zones more when 0.5 mitigation, BOS and liquidity sweep line up. The zone is more convincing when structure and risk both make sense.
Обсуждение
Частые вопросы
Commodities
XAUUSD
Продукты, доступные в cTrader Store, включая торговых ботов, индикаторы и плагины, предоставляются сторонними разработчиками и доступны исключительно в информационных и технических целях. cTrader Store не является брокером и не предоставляет инвестиционные консультации, персональные рекомендации или какие-либо гарантии будущей доходности.
Больше от этого автора


Цена
15
Продажи
4.62K
Бесплатные установки