
Penerangan
*WAKTU PEMBUKAAN AKAN BERBEZA ANTARA KELAS ASET
*NILAI WAKTU DEFAULT ADALAH UNTUK NQ/ES/YM (FUTURES)
*NILAI WAKTU SEPATUTNYA DALAM MASA STANDARD TIMUR (EST)
Ciri-ciri Utama:
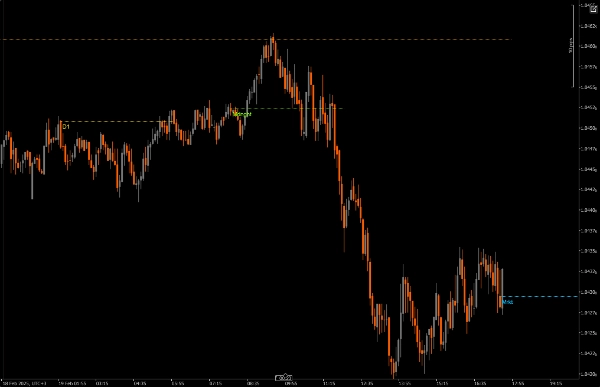
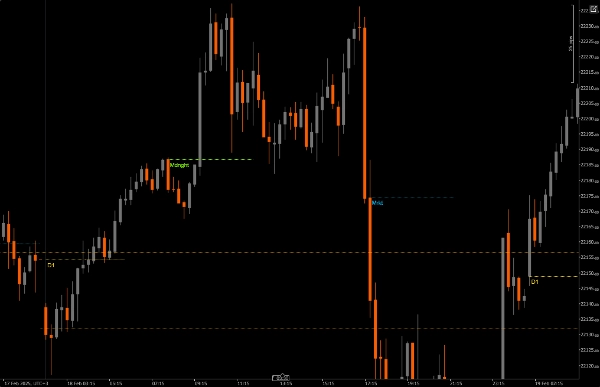
Tahap Harga Berdasarkan Masa
Melakar garis harga pembukaan pada harga pembukaan masa pasaran utama
Semua masa diselaraskan dengan Masa Standard Timur (EST)
Setiap tempoh masa dikodkan warna untuk pengenalan mudah
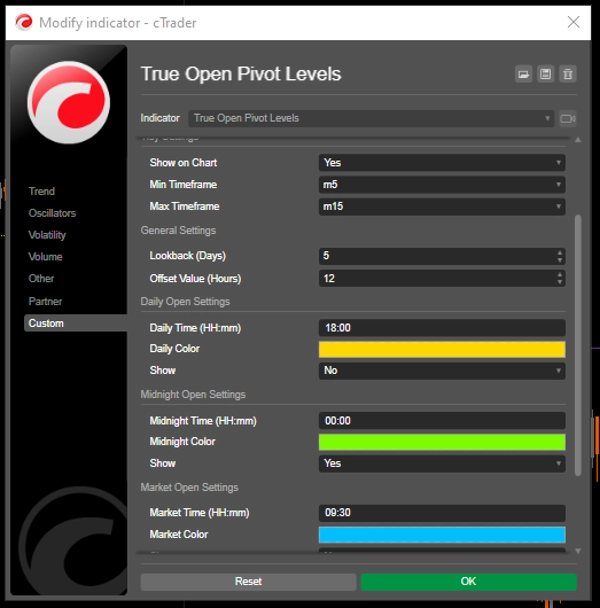
3 Penanda Sesi Boleh Disesuaikan:
Pembukaan Harian (12:00 AM EST) - Emas Default
Pembukaan Tengah Malam (4:00 AM EST) - Hijau Default
Pembukaan Pasaran (9:30 AM EST) - Biru Default
Setiap sesi boleh dihidupkan/dimatikan secara bebas
Penyesuaian Visual:
Ketebalan garis boleh dilaras
Pelbagai gaya garis (pejal, bertitik, berjalur)
Warna boleh disesuaikan untuk setiap sesi
Label masa pilihan yang menunjukkan masa EST
Offset garis boleh dikonfigurasikan sehingga 48 jam
Sokongan Rangka Masa Fleksibel:
Tetapkan rangka masa minimum dan maksimum untuk paparan
Mengelakkan carta menjadi sesak pada rangka masa yang tidak sesuai
Dioptimumkan untuk rangka masa M5-M15
Tetapan Masa:
Semua masa adalah dalam EST
Sesuaikan masa sesi untuk padankan strategi dagangan anda
Laraskan tempoh garis berdasarkan keperluan analisis anda
Tetapan Visual:
Laraskan ketebalan garis untuk keterlihatan
Pilih gaya garis berdasarkan kejelasan carta
Hidupkan/matikan label mengikut keperluan
Sesuaikan warna untuk padankan tema carta anda
Tetapan Am:
Tentukan rangka masa minimum/maksimum
Laraskan tempoh garis untuk analisis lanjutan
Amalan Terbaik:
Mulakan dengan tetapan default dan laraskan mengikut keperluan anda
Gunakan warna berbeza untuk setiap sesi bagi pembezaan yang jelas
Pertimbangkan untuk mengurangkan tempoh garis pada rangka masa lebih rendah untuk mengelakkan kesesakan
Hidupkan label pada mulanya untuk memahami masa, matikan jika carta menjadi terlalu sibuk
Padankan tetapan rangka masa penunjuk dengan rangka masa dagangan anda
Penunjuk ini amat berguna untuk:
Pedagang harian yang memfokuskan pada pasaran AS
Pedagang yang perlu menjejaki pembukaan sesi
Mereka yang berdagang sekitar acara pasaran utama
Pedagang yang menganalisis tindakan harga multi-sesi
Sesiapa yang memerlukan rujukan visual jelas untuk masa pasaran EST
Ringkasan
Ulasan pelanggan
5 | 100 % | |
4 | 0 % | |
3 | 0 % | |
2 | 0 % | |
1 | 0 % |


