

Описание
Этот инструмент позволяет пользователям задавать временной интервал для анализа, например дневной, и отображать уровни максимумов и минимумов на своих графиках с настраиваемыми цветами, стилями и толщиной. Он поддерживает несколько предыдущих дней, что облегчает выявление значимых зон ценового действия. Индикатор также оснащён опциональными метками для ясности, помогая трейдерам принимать обоснованные решения на основе исторических данных о ценах. Идеально подходит как для новичков, так и для опытных трейдеров, этот инструмент улучшает анализ рынка и торговые стратегии.
Особенности
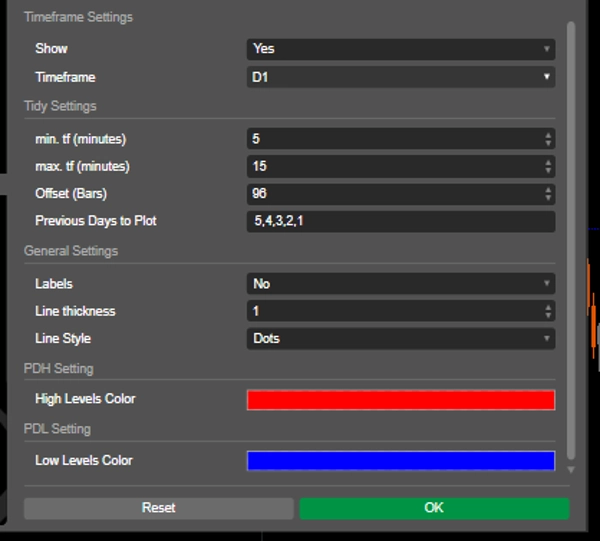
Настраиваемый временной интервал: пользователи могут выбрать конкретный временной интервал (например, дневной) для анализа предыдущих максимумов и минимумов, что позволяет создавать визуализацию, соответствующую их торговым стратегиям.
Несколько предыдущих дней: возможность отображать уровни максимумов и минимумов за несколько предыдущих дней обеспечивает всесторонний обзор значимых зон ценового действия.
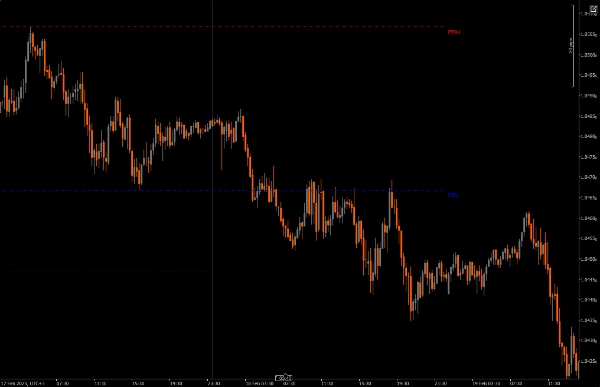
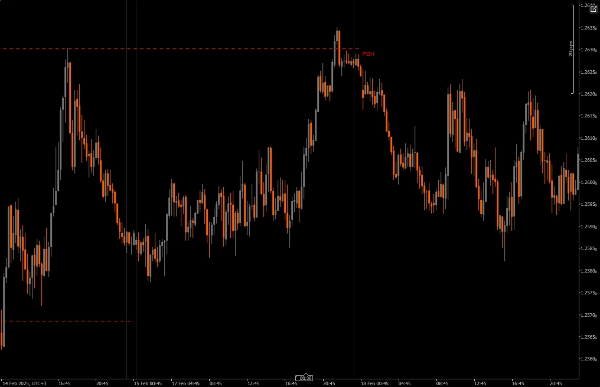
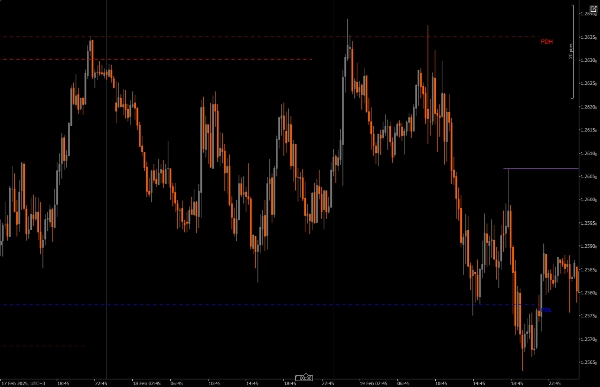
Динамические трендовые линии: индикатор рисует трендовые линии для максимума и минимума предыдущего дня, что облегчает быстрое выявление потенциальных зон разворота.
Опции маркировки: пользователи могут включить метки для отображения текущих значений максимумов и минимумов непосредственно на графике, повышая ясность и понимание.
Визуальная настройка: трейдеры могут настраивать цвета линий, стили и толщину в соответствии со своими предпочтениями для улучшения читаемости графика.
Ограничения по временным интервалам: индикатор гарантирует работу только в пределах заданных минимальных и максимальных настроек временного интервала, уменьшая загромождение графика при переключении между другими интервалами.
Важные моменты
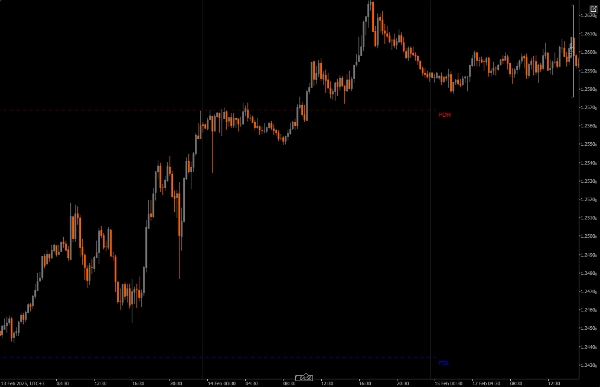
PDH или PDL на рынке могут использоваться как уровень ликвидности (DOL) или для определения зоны разворота.
Развороты могут формироваться от PDH и PDL при неудаче сдвига цены.
Когда цена уважает массив PD сверху или снизу, не удаётся сдвинуться выше дневного максимума или минимума, можно ожидать следующую свечу.
Вероятнее ли, что цена достигнет предыдущего дневного максимума или минимума? При использовании PDH PDL как уровня ликвидности (DOL)
Установка: загрузите и установите Daily Range Liquidity Zones (PDH PDL) на вашу платформу cAlgo.
Настройка: откройте настройки индикатора и выберите желаемый временной интервал для анализа, количество предыдущих дней для отображения, а также настройте визуальные параметры, такие как цвет и толщина линий.
Использование индикатора: индикатор автоматически отобразит уровни максимума и минимума предыдущего дня на вашем графике согласно заданным настройкам.
Анализ: наблюдайте за нанесёнными уровнями во время торговли. Используйте эти уровни для определения потенциальных разворотов и принятия обоснованных торговых решений.
Рекомендуемые сопутствующие инструменты
cTrader: родная платформа для cAlgo, обеспечивающая удобную среду для использования и настройки индикаторов.
Инструменты технического анализа: сочетайте этот индикатор с другими инструментами, такими как Fair Value Gaps (FVG) и индикаторы паттернов разворота (CRT), чтобы улучшить вашу торговую стратегию и анализ рынка.
Инструменты управления рисками: используйте калькуляторы размера позиции и инструменты стоп-лосс для эффективного управления рисками при торговле вокруг выявленных уровней максимумов и минимумов.
Интегрируя Daily Range Liquidity Zones (PDH PDL) с этими инструментами, трейдеры могут улучшить анализ рынка и повысить шансы на успех в сложностях ценового действия.
Сводка
Отзывы покупателей
5 | 100 % | |
4 | 0 % | |
3 | 0 % | |
2 | 0 % | |
1 | 0 % |


![Логотип продукта "[Stellar Strategies] Market Structure Breakout"](https://cdn.ctrader.com/image/webp/bceec265-3247-4b11-915f-6295a29c106d_28465)


