
คำอธิบาย
*เวลาการเปิดจะต่างกันระหว่างประเภทสินทรัพย์
*ค่ามาตรฐานเวลาสำหรับ NQ/ES/YM (ฟิวเจอร์ส)
*ค่าของเวลา ควรเป็นเวลามาตรฐานตะวันออก (EST)
คุณสมบัติหลัก:
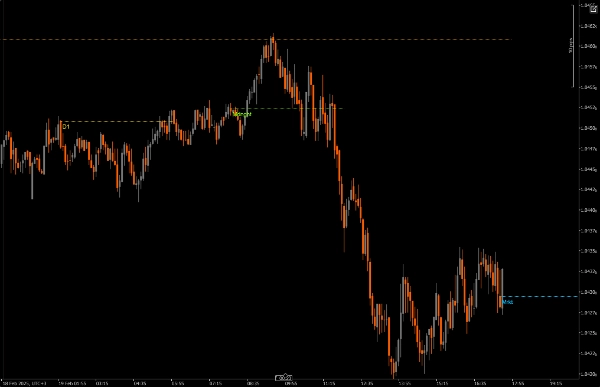
ระดับราคาตามเวลา
แสดงเส้นราคาที่เปิดในเวลาตลาดสำคัญ
เวลาทั้งหมดถูกซิงโครไนซ์เป็นเวลามาตรฐานตะวันออก (EST)
แต่ละช่วงเวลาจะมีสีที่แตกต่างกันเพื่อการระบุที่ง่าย
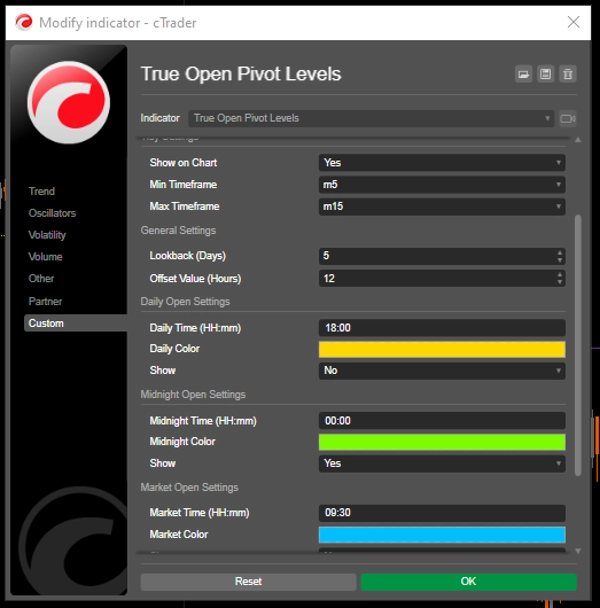
3 ตัวบ่งชี้ช่วงเวลาที่ปรับแต่งได้:
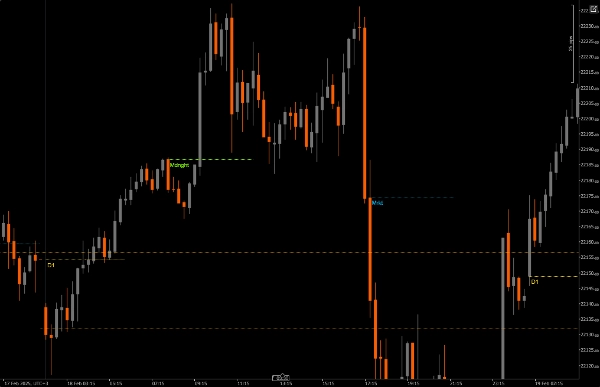
เปิดประจำวัน (12:00 AM EST) - สีทองมาตรฐาน
เปิดเที่ยงคืน (4:00 AM EST) - สีเขียวมาตรฐาน
เปิดตลาด (9:30 AM EST) - สีน้ำเงินมาตรฐาน
แต่ละช่วงเวลาสามารถเปิด/ปิดได้อย่างอิสระ
การปรับแต่งภาพ:
ปรับความหนาของเส้นได้
สไตล์เส้นหลายแบบ (ทึบ, จุด, ขีด)
สีที่ปรับแต่งได้สำหรับแต่ละช่วงเวลา
ป้ายเวลาที่แสดงเวลา EST เป็นทางเลือก
การเลื่อนเส้นปรับได้สูงสุด 48 ชั่วโมง
รองรับกรอบเวลาที่ยืดหยุ่น:
ตั้งค่ากรอบเวลาขั้นต่ำและสูงสุดสำหรับการแสดงผล
ป้องกันกราฟรกในกรอบเวลาที่ไม่เหมาะสม
เหมาะสำหรับกรอบเวลา M5-M15
การตั้งค่าเวลา:
เวลาทั้งหมดเป็น EST
ปรับเวลาช่วงให้ตรงกับกลยุทธ์การเทรดของคุณ
ปรับระยะเวลาของเส้นตามความต้องการวิเคราะห์
การตั้งค่าภาพ:
ปรับความหนาของเส้นเพื่อความชัดเจน
เลือกสไตล์เส้นตามความชัดเจนของกราฟ
เปิด/ปิดป้ายตามความจำเป็น
ปรับสีให้เข้ากับธีมกราฟของคุณ
การตั้งค่าทั่วไป:
กำหนดกรอบเวลาขั้นต่ำ/สูงสุด
ปรับระยะเวลาของเส้นสำหรับการวิเคราะห์ระยะยาว
แนวทางปฏิบัติที่ดีที่สุด:
เริ่มต้นด้วยการตั้งค่าเริ่มต้นและปรับตามความต้องการ
ใช้สีต่างกันสำหรับแต่ละช่วงเวลาเพื่อความชัดเจน
พิจารณาลดระยะเวลาของเส้นในกรอบเวลาต่ำเพื่อป้องกันความรก
เปิดป้ายในตอนแรกเพื่อเข้าใจเวลา ปิดถ้ากราฟรกเกินไป
ตั้งค่ากรอบเวลาของตัวบ่งชี้ให้ตรงกับกรอบเวลาการเทรดของคุณ
ตัวบ่งชี้นี้เหมาะสำหรับ:
นักเทรดรายวันที่เน้นตลาดสหรัฐ
นักเทรดที่ต้องติดตามการเปิดช่วงเวลา
ผู้ที่เทรดรอบเหตุการณ์ตลาดสำคัญ
นักเทรดที่วิเคราะห์ราคาหลายช่วงเวลา
ใครก็ตามที่ต้องการการอ้างอิงภาพที่ชัดเจนสำหรับเวลาตลาด EST
สรุป
รีวิวจากลูกค้า
5 | 100 % | |
4 | 0 % | |
3 | 0 % | |
2 | 0 % | |
1 | 0 % |


