
Beschreibung
Institutionelle VWAP-Suite mit Standardabweichungsbändern
Handeln Sie dort, wo die Institutionen handeln. Die Institutional VWAP Suite bietet den genauesten "Fair Value"-Benchmark für jede Intraday-Session, der weltweit von Hedgefonds und algorithmischen Handelsdesks verwendet wird.
Der Benchmark des institutionellen Handels
VWAP ist nicht nur ein weiterer Indikator; es ist der Durchschnittspreis, zu dem ein Wertpapier im Laufe des Tages gehandelt wurde, basierend auf Volumen und Preis. Es ist das Hauptwerkzeug, das von Großhändlern verwendet wird, um die Effizienz des Einstiegs zu bestimmen. Diese Suite erweitert den Standard-VWAP durch Hinzufügen von Volatilitätsbändern (Standardabweichung), mit denen Sie überkaufte und überverkaufte Zustände mit mathematischer Präzision erkennen können.
Hauptmerkmale
-
- Dynamische Intraday-Verankerung: Wählen Sie, ob die Berechnung zu Beginn des Tages oder zu einer benutzerdefinierten Sitzungszeit (z. B. London- oder New York-Eröffnung) zurückgesetzt wird, um sich an die spezifische Marktlage anzupassen.
- Mehrstufige Volatilitätsbänder:
-
- Band 1 (1 Standardabweichung): Erfasst etwa 68 % der Kursbewegungen – ideal für Trendfolgen und Rücksetzer.
- Band 2 (2 Standardabweichungen): Erfasst 95 % der Kursbewegungen – perfekt, um größere Markterschöpfungen und Wendepunkte zu identifizieren.
- Echte institutionelle Logik: Im Gegensatz zu Standard-Durchschnitten verwendet dies kumulatives Tick-Volumen, wodurch starkes Handelsvolumen mehr Gewicht erhält als geringes Volumen.
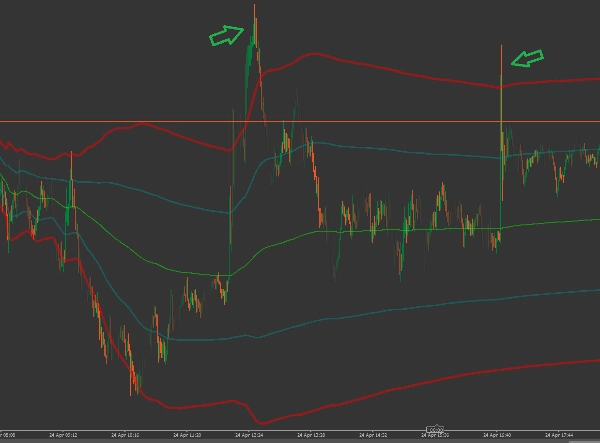
- Klare visuelle Hierarchie: Verfügt über eine goldene VWAP-"Basis"-Linie mit farbcodierten Abweichungsbändern für sofortige Chartlesbarkeit.
- Universelle Kompatibilität: Unverzichtbar für den Handel mit Indizes (DAX, NASDAQ), Forex und Rohstoffen, bei denen volumengewichtete Preise entscheidend sind.
Handelsstrategie
-
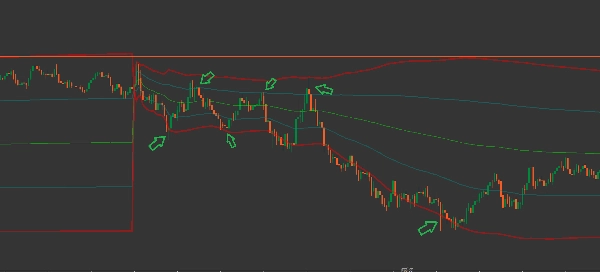
- Der Rücksetzer: In einem Trendmarkt suchen Sie nach einer Rückkehr des Preises zur goldenen VWAP-Linie für hochwahrscheinliche Einstiege in Trendrichtung.
- Die Mittelwertumkehr: Wenn der Preis die roten gepunkteten Bänder (oberes/unteres Band 2) berührt oder überschreitet, ist er statistisch überdehnt. Suchen Sie nach Umkehrungen zurück zum VWAP.
- Sitzungsbeginn: Stellen Sie die Startzeit auf "08:00" oder "09:00", um das spezifische Volumenprofil der europäischen oder US-Marktöffnung zu erfassen.
Parameter
-
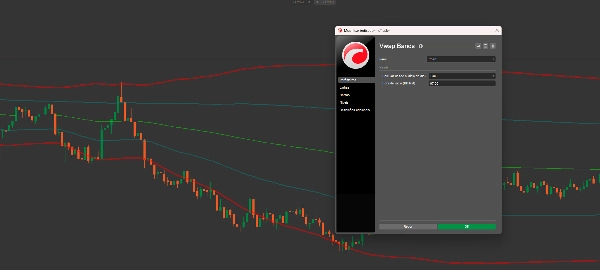
- Berechnung ab Tagesbeginn: Umschalten zwischen einem Standard-Reset um 00:00 oder einem manuellen Zeit-Reset.
- Startzeit (HH:MM): Definieren Sie genau, wann Ihr "Handelstag" beginnt (z. B. 08:00 für London Open).
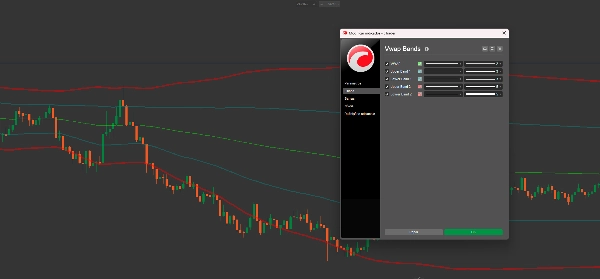
- Visuelle Stile: Vollständig anpassbare Linienstärken und -stile für den VWAP und alle 4 Abweichungsbänder.
Warum Sie diese Suite brauchen
Wenn Sie ohne VWAP handeln, verpassen Sie den "Value Area". Dieser Indikator zeigt Ihnen, ob Sie zu einem Aufpreis oder Rabatt im Vergleich zum restlichen Markt kaufen. Es ist das wichtigste Werkzeug für Intraday-Trader, die ihr Setup professionalisieren möchten.
Richten Sie Ihre Strategie an den "Großen Fischen" aus. Fügen Sie die Institutional VWAP Suite noch heute zu Ihren cTrader-Charts hinzu.
Zusammenfassung
This suite enhances standard VWAP by adding two volatility bands: Band 1 (1 standard deviation) captures about 68% of price action, useful for trend-following and pullbacks; Band 2 (2 standard deviations) covers 95% of price action, highlighting potential market exhaustion and reversal points. The calculation uses cumulative tick volume, emphasizing heavy trading activity over low-volume noise.
Key features include dynamic intraday anchoring with customizable session start times (e.g., London or New York open), a clear visual hierarchy with a gold VWAP line and color-coded deviation bands, and universal compatibility across indices (DAX, NASDAQ), Forex, and commodities markets.
Traders can apply strategies such as entering on pullbacks to the VWAP line, identifying mean reversion when price touches outer bands, and aligning session start times to capture specific market volume profiles. Visual styles and calculation parameters are fully adjustable to fit individual trading preferences.
Kundenbewertungen
5 | 100 % | |
4 | 0 % | |
3 | 0 % | |
2 | 0 % | |
1 | 0 % |


![„[Hamster-Coder] Moving Average MTF“-Logo](https://cdn.ctrader.com/image/webp/b11b98b1-194d-4b8e-b00e-d611826ad159_31226)


