
Beschreibung
Visualizer für institutionelle Unterstützung & Widerstand
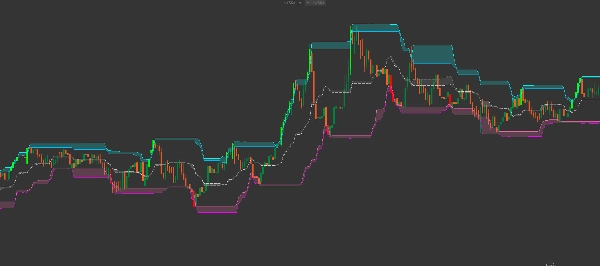
Der Smart Donchian Cloud Reversal ist ein Volatilitätskanal der nächsten Generation, der entwickelt wurde, um Zonen mit hoher Wahrscheinlichkeit für Umkehrungen zu identifizieren. Im Gegensatz zu den Standard-Donchian-Kanälen, die nur die höchsten Hochs und niedrigsten Tiefs verfolgen, analysiert dieser Indikator die Beziehung zwischen Kerzendochten und Kerzenkörpern, um "Druckwolken" zu zeichnen.
Diese Wolken fungieren als dynamische Zonen von Angebot und Nachfrage und zeigen Ihnen genau, wo der Markt wahrscheinlich ins Stocken gerät oder sich umkehrt.
Fortschrittliche Multi-Cloud-Architektur
Dieser Indikator verfügt über ein ausgeklügeltes 3-Schichten-Wolkensystem:
-
- Die Widerstandswolke (Cyan/Blau): Oben gelegen visualisiert sie die Lücke zwischen dem höchsten Docht und dem höchsten Kerzenkörper. Dies ist die "Verkaufszone".
- Die Gleichgewichtswolke (Grau/Silber): Ein zentrales Band, das das Gleichgewicht des Marktes verfolgt. Es repräsentiert den fairen Wert-Mittelpunkt zwischen Dochten und Körpern.
- Die Unterstützungswolke (Pink/Magenta): Unten gelegen visualisiert sie die Lücke zwischen dem niedrigsten Docht und dem niedrigsten Kerzenkörper. Dies ist die "Kaufzone".
Wichtige Handelsfunktionen
-
- ATR-Volatilitätsfilter: Beinhaltet einen eingebauten ATR (Average True Range)-Multiplikator, um die äußeren Bänder leicht zu verschieben, wodurch Marktrauschen und "Stop-Hunts" herausgefiltert werden.
- Intelligente Kerzenfärbung: Der Indikator hebt automatisch den Ausbruchs-Momentum hervor:
- LIMONEN-Kerzen: Der Preis hat über der oberen Widerstandswolke geschlossen (bullischer Ausbruch).
- ROTE Kerzen: Der Preis hat unter der unteren Unterstützungswolke geschlossen (bärischer Ausbruch).
- Docht- vs. Körper-Logik: Durch die Betrachtung der "Wolkendicke" können Sie die Volatilität einschätzen. Eine dicke Wolke bedeutet lange Dochte (hohe Ablehnung/Unentschlossenheit), während eine dünne Wolke starke, entschlossene Kursbewegungen anzeigt.
Wie man mit Smart Donchian Clouds handelt
1. Die Mittelwertumkehr (Scalping) » Achten Sie darauf, dass der Preis in die Widerstandswolke eintritt, ohne darüber zu schließen. Dies deutet oft auf einen "Fakeout" hin und signalisiert einen Short-Einstieg mit hoher Wahrscheinlichkeit zurück zur Mittellinie.
2. Der Trend-Ausbruch » Wenn eine Kerze Limonenfarben wird (Schlusskurs über dem oberen Dochtfilter), signalisiert dies, dass die Bullen die Widerstandszone überwunden haben. Dies ist ein starkes Signal für trendfolgende Strategien.
3. Der Unterstützungs-Bounce »Beobachten Sie die Unterstützungswolke (Pink). Wenn der Preis diese Zone während einer Korrektur in einem Aufwärtstrend berührt, stellt dies einen "Value Buy"-Bereich dar, in dem institutionelle Käufer oft eingreifen.
Technische Parameter
-
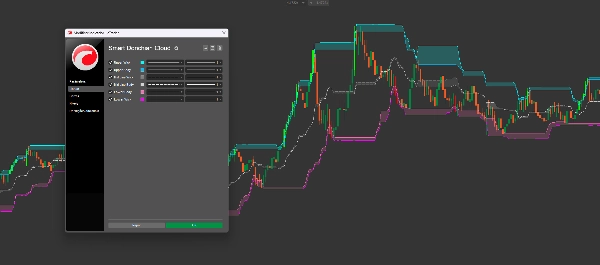
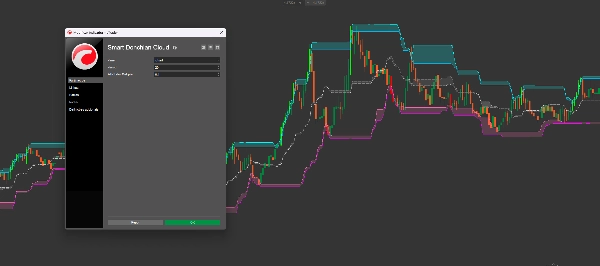
- Periode: Der Rückblickzeitraum zur Berechnung der Hochs und Tiefs (Standard: 20).
- ATR-Filter-Multiplikator: Passt die "Polsterung" um die Extreme an, um nicht in kleinere Ausschläge hineingezogen zu werden.
- Vollständig anpassbare Farben: Passen Sie die obere, mittlere und untere Wolke an Ihre persönliche Chartvorlage an.
Warum dieses Tool unverzichtbar ist
Die meisten Trader scheitern, weil sie Unterstützung und Widerstand als einzelne Linien behandeln. In Wirklichkeit sind sie Zonen. Der Smart Donchian Cloud Reversal kartiert diese Zonen mathematisch und gibt Ihnen ein klareres Bild der Marktstruktur als jeder traditionelle Kanalindikator.
Zusammenfassung
Kundenbewertungen
5 | 100 % | |
4 | 0 % | |
3 | 0 % | |
2 | 0 % | |
1 | 0 % |


