
AutoLines™ Support & Resistance
Indikator
2 käufe
Version 1.0, May 2025
Windows, Mac
4.5
Bewertungen: 4
Beschreibung
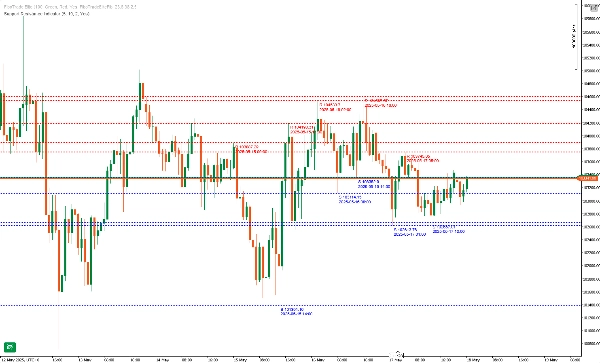
FlexSR ist Ihr professioneller All-in-One-Unterstützungs- und Widerstandsindikator für cTrader. Er identifiziert automatisch Pivot-Hochs und -Tiefs über Ihren gewählten Rückblickzeitraum, zeichnet bis zu N der neuesten Levels und verlängert sie über das gesamte Diagramm. Mit vollständig anpassbaren Farben, Linienarten, Dicke und optionalen Datums-Preis-Etiketten bietet Ihnen FlexSR kristallklare Zonen, in denen der Preis wahrscheinlich pausiert, sich umkehrt oder ausbricht – damit Sie mit Vertrauen handeln können.
Hauptmerkmale
Zusammenfassung
KI-Zusammenfassung
AutoLines™ Support & Resistance (FlexSR) is a professional indicator for cTrader that automatically detects pivot highs and lows over a user-defined lookback period. It plots up to N of the most recent support and resistance levels and extends these lines across the chart for continuous visibility. The indicator features customizable colors, line styles, thickness (1–5 px), and optional date-price labels for clear identification of key zones where price may stall, reverse, or break out.
Key functionalities include:
- Automatic pivot detection scanning each bar for true swing highs and lows.
- Dynamic management of displayed levels, showing only the user-set maximum number of lines to maintain chart clarity.
- Non-interactive, lockable lines that redraw automatically to prevent accidental changes.
- Real-time updates on every tick, ensuring levels remain current even in fast markets.
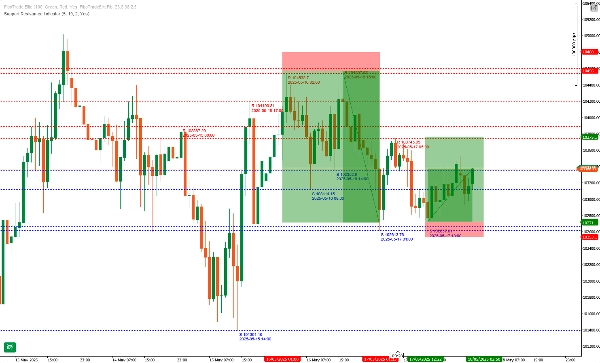
FlexSR supports intuitive trade management by visually highlighting confluence zones and providing clear support and resistance references. It is designed for ease of use with sensible default settings and minimal configuration. The indicator aids traders in identifying potential reversal and breakout points, supporting various trading strategies with precise and reliable level plotting.
Key functionalities include:
- Automatic pivot detection scanning each bar for true swing highs and lows.
- Dynamic management of displayed levels, showing only the user-set maximum number of lines to maintain chart clarity.
- Non-interactive, lockable lines that redraw automatically to prevent accidental changes.
- Real-time updates on every tick, ensuring levels remain current even in fast markets.
FlexSR supports intuitive trade management by visually highlighting confluence zones and providing clear support and resistance references. It is designed for ease of use with sensible default settings and minimal configuration. The indicator aids traders in identifying potential reversal and breakout points, supporting various trading strategies with precise and reliable level plotting.
Indikatorprofil
Kundenbewertungen
4.5
Bewertungen: 4
5 | 50 % | |
4 | 50 % | |
3 | 0 % | |
2 | 0 % | |
1 | 0 % |
Kundenbewertungen
November 9, 2025
AutoLines™ S&R does the heavy lifting - clear, dynamic levels that adapt to price action. Perfect for traders who love clean charts and structure. Missing alerts, but performance and accuracy make it a must-have for support/resistance setups.
May 30, 2025
May 28, 2025
May 24, 2025
messy signals are easier to question, but overconfidence is the real danger.
Diskussion
Häufig gestellte Fragen (FAQ)
Breakout
Über den cTrader Store verfügbare Produkte, einschließlich Handelsbots, Indikatoren und Plugins, werden von externen Entwicklern bereitgestellt und nur zu Informations- und technischen Zugriffszwecken verfügbar gemacht. cTrader Store ist kein Broker und erbringt keine Anlageberatung, persönlichen Empfehlungen oder eine Garantie für zukünftige Performance.


Preis
Seit 22/11/2024
133
Verkäufe
2.58K
Kostenlose Installationen