
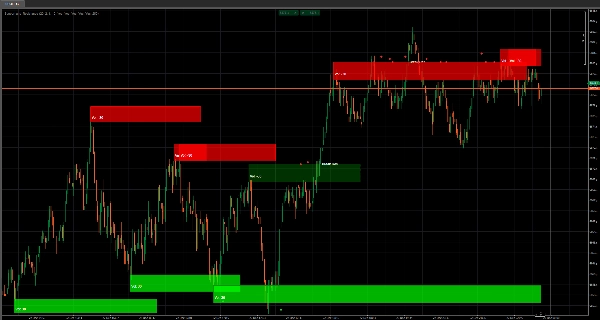
✅ Unterstützungs- und Widerstandsboxen mit hohem Volumen — ordnet automatisch echte „Verteidigungs-/Durchbruchs“-Zonen zu
✅ Volumen-gewichtete Zonenstärke (dynamische Deckkraft) — stärkeres Volumen = stärkere Box-Präsenz
✅ Pivot-basierte Zonenerstellung (Lookback) — nur bestätigte Levels werden zu Zonen (weniger Rauschen)
✅ Adaptive Box-Breite (ATR-basiert) — Zonen passen sich der aktuellen Volatilität an, keine festen Schätzungen
✅ Live-Box-Erweiterung — Zonen projizieren sich weiter nach vorne, während sich der Preis entwickelt
✅ Durchbruch-/Halt-Intelligenz — erkennt, wann eine Zone hält oder durchbrochen wird und reagiert sofort
✅ Visuelle Ereignismarken (Diamanten) — klare „Halt-/Flip“-Bestätigungen ohne Überinterpretation
✅ Durchbruch-Labels — klare „Break Sup / Break Res“-Ereignisse im Chart
✅ Volle visuelle Kontrolle — Umschalter für Boxen / Volumentext / Diamanten / Durchbruch-Labels
✅ Auto-Clean-System — verhindert Chart-Unordnung durch automatisches Entfernen alter Ereignismarken
✅ Maximale Boxen-Kontrolle — harte Grenze zur schnellen Performance und lesbaren Charts
Unterstützung & Widerstand (High Volume Boxes) ist kein einfaches S/R-Tool, das zufällige Linien ausspuckt.
Dieser Indikator wurde entwickelt, um Ihnen etwas viel Wertvolleres zu zeigen:
Wo der Preis echtes Interesse erzeugt hat — und wo er höchstwahrscheinlich wieder reagieren wird.
Anstatt „schöne Levels“ zu zeichnen, baut er hochvolumige Angebots- & Nachfragezonen als Boxen direkt in Ihrem Chart auf, damit Sie die Struktur wie ein Profi handeln können:
Zone identifizieren → Reaktion beobachten → Halt oder Durchbruch handeln.
Der Kernvorteil: Volumen + Struktur, kein Raten
Jede Box wird nur erstellt, wenn zwei Bedingungen erfüllt sind:
- Ein bestätigter Pivot (Struktur zählt)
- Ein Volumen-Extrem (Interesse zählt)
Das bedeutet, Sie werden nicht mit schwachen Zonen zugespamt.
Sie erhalten weniger Zonen — aber die, die Sie bekommen, sind die Zonen, die wirklich wichtig sind.
Stärke, die Sie sehen können (Deckkraft = Kraft)
Hier wird es unfair für diejenigen, die „blinde“ S/R handeln.
Die Füll-Deckkraft der Box skaliert mit dem Volumen, sodass Sie sofort wissen:
- Blasse Box = geringes Interesse (beobachten)
- Starke Box = hohes Interesse (respektieren)
Keine zusätzlichen Indikatoren, keine Interpretationsakrobatik — es ist buchstäblich sichtbar.
Volatilitätsadaptive Zonen (ATR-Breite)
Märkte bewegen sich nicht jeden Tag gleich.
Dieser Indikator passt die Box-Dicke mit einer langen ATR-Basislinie an, sodass sich Zonen mit der Volatilität ausdehnen oder verengen.
Ergebnis:
Zonen bleiben realistisch statt zu dünn, um relevant zu sein, oder so breit, dass sie nutzlos sind.
Halt- vs. Durchbruch-Intelligenz (und sofortiges visuelles Feedback)
Eine Zone ist nur wertvoll, wenn Sie lesen können, was der Preis damit macht.
Dieser Indikator verfolgt:
- Hält (Abweisung / Respekt)
- Ausbrüche (Akzeptanz durch die Zone)
…und aktualisiert dann das Styling live:
- Hält behalten die ursprüngliche „Unterstützungs-/Widerstands-Identität“
- Durchbrüche kehren das Verhalten um (Unterstützung kann Widerstand werden und umgekehrt)
- Das Durchbruch-Styling kann zu gestrichelt + neuer Farbton wechseln, sodass Sie sofort wissen:
„Dieses Level hat gerade seinen Charakter geändert.“
Diamanten + Durchbruch-Labels: Klare Entscheidungs-Auslöser
Sie erhalten einfache, hochsignifikante Ereignismarker:
- Diamanten zur Hervorhebung von Halt-/Flip-Ereignissen
- Durchbruch-Labels damit Sie nie den Moment verpassen, wenn ein Level bricht
Es ist der Unterschied zwischen denken, etwas sei gebrochen… und wissen, dass es gebrochen ist.
Für den echten Handel gebaut: Kontrolle + saubere Charts
Dieser Indikator wurde entwickelt, um auch nach Stunden des Handels nutzbar zu bleiben:
- Nur Zonen gewünscht? Diamanten/Labels ausschalten.
- Reine Signale gewünscht? Volumentext ausschalten.
- Performance gewünscht? Max Boxes begrenzen.
- Unordnung vermeiden? Auto-Clean Events hält den Chart scharf, indem alte Markierungen automatisch entfernt werden.
Sie bleiben auf die aktuelle Schlacht fokussiert — nicht in der Vergangenheit ertränkt.
Empfohlene Einstellungen (Schnellstart)
✅ Lookback-Periode: 20 (ausgewogene Bestätigung)
✅ Volumenfilter-Länge: 2 (reaktionsschnell)
✅ Box-Breiten-Multiplikator: 1.0 (neutral)
✅ Boxen anzeigen: EIN
✅ Diamanten + Durchbruch-Labels: EIN (bis Sie das Verhalten lernen, dann verfeinern)
✅ Auto-Clean Events: EIN (sauber halten)
Was Ihnen dieser Indikator wirklich gibt
Eine visuelle Karte davon, wo der Markt seine Karten gezeigt hat — und eine Live-Lesung, ob der Preis diese Zone respektiert oder zerstört.
Wenn Sie Ausbrüche, Rücksetzer, Umkehrungen oder Retests handeln:
wird dies Ihre „Schlachtfeld-Überlagerung“.


