present
Sign up and get $50 off your first purchase
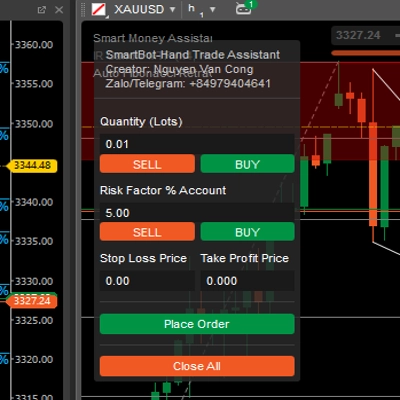
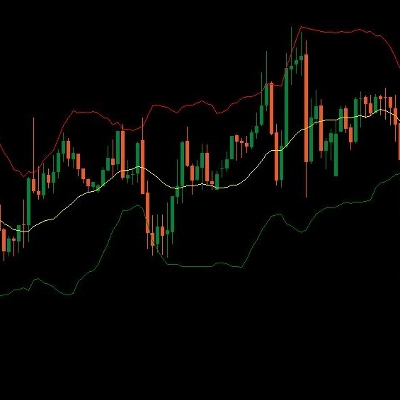
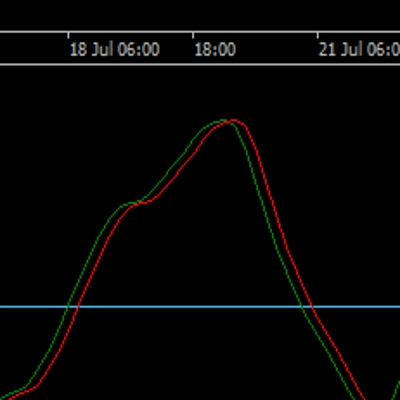
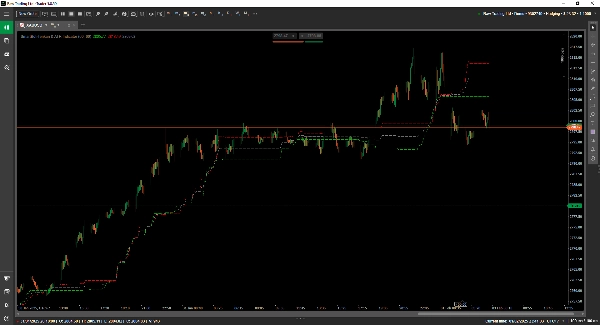
Trading product for SmartBot-Tenkan & ATR Indicator Indicator ATR, image 1
SmartBot-Tenkan & ATR Indicator
Indicator
2 purchases
Version 1.0, Feb 2025
Windows, Mac
4.5
Reviews: 2
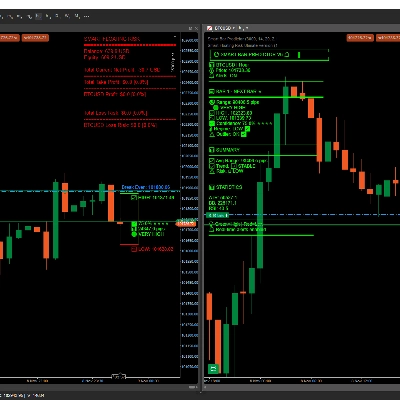
Trading product for SmartBot-Tenkan & ATR Indicator Indicator ATR, image 2
Since 29/11/2024
36
Sales
1.13K
Free installs

Description

The Tenkan-ATR Indicator is a powerful and innovative tool designed for cTrader traders who seek to enhance their technical analysis by combining the strengths of two well-known indicators: the Tenkan line from the Ichimoku Kinko Hyo system and the Average True Range (ATR). This unique fusion creates a dynamic indicator that not only identifies potential trend reversals and market momentum but also incorporates volatility-based insights to improve trade timing and risk management.

The Tenkan line, often referred to as the "conversion line," is a fast-moving average that highlights short-term price momentum and potential trend changes. On the other hand, the ATR measures market volatility, providing valuable context for price movements. By integrating these two components, the Tenkan-ATR Indicator offers traders a comprehensive view of the market, enabling them to make more informed decisions in both trending and ranging conditions.

Whether you are a scalper, day trader, or swing trader, the Tenkan-ATR Indicator can be customized to suit your trading style and time frame. Its intuitive design and real-time signals make it an essential addition to any trader's toolkit, helping to identify high-probability setups while managing risk effectively.

Summary

AI summary
The SmartBot-Tenkan & ATR Indicator for cTrader combines the Tenkan line from the Ichimoku Kinko Hyo system with the Average True Range (ATR) to enhance technical analysis. The Tenkan line acts as a fast-moving average that highlights short-term price momentum and potential trend reversals. The ATR measures market volatility, providing context for price movements. By integrating these two indicators, this tool offers a comprehensive market view that supports decision-making in both trending and ranging conditions. It delivers real-time signals to identify potential trend changes and momentum shifts while incorporating volatility insights to improve trade timing and risk management. The indicator is customizable to fit various trading styles and timeframes, including scalping, day trading, and swing trading. Its design aims to help traders identify high-probability setups and manage risk effectively.
Indicator profile

Customer reviews

4.5
Reviews: 2
5
50 %
4
50 %
3
0 %
2
0 %
1
0 %
Customer reviews
February 11, 2025
it works as a side layer because bad impulses show up less often in the notes, and It needs a few bad trades in the sample too.
February 10, 2025
The signal still needs a chart check, no surprise there, and the setup needs patience.

Discussion

FAQ
ATR
Products available through cTrader Store, including trading bots, indicators and plugins, are provided by third-party developers and made available for informational and technical access purposes only. cTrader Store is not a broker and does not provide investment advice, personal recommendations or any guarantee of future performance.

More from this author

cBot
Forex
BTCUSD
+9
cBot : Hand Trade Assistant
Indicator
AI
ATR
+27
🔮 Smart Bar Predictor - Professional Volatility Forecasting Indicator
Indicator
Forex
Indices
+1
The Floating Risk Indicator is an essential tool for traders who prioritize risk management.
cBot
RSI
Indices
SALE OFF!!! this innovative bot combines the precision of Fibonacci Retracement, EMA and RSI...
Indicator
MACD
Forex
+2
a revolutionary indicator that integrates volume into MACD.
Indicator
RSI
MACD
This indicator is a combination of MACD and RSI into one. This is perfect fusion and powerful indicator ever.
cBot
RSI
Indices
This bot is made of Fibonacci, EMA and RSI.
cBot
Smart Daily Scalping with H1 Time Frame - XAUUSD.
cBot
Forex
Crypto
+3
high-performance trading bot that redefines market precision! Built with advanced RSI, TEMA of RSI, and..
cBot
RSI
Work with TimeFrame M5.
cBot
RSI
This Bot work with M5 TimeFrame.
Indicator
MCDX is a powerful and innovative indicator.

You may also like

Indicator
Forex
BTCUSD
+8
The traditional Hull Moving Average with different colours based on the slope (direction) of the trend.
Indicator
Channel
Imbalance
+2
Adaptive volatility channel based on moving average and standard deviation (σ).
Indicator
Forex
Crypto
+3
MARainbow gives you the edge with four customizable moving averages—each color-coded for instant recognition.
Indicator
ADX
ATR
+1
Indicador de Sinais Visuais para Spotcrude (WTI) ou SpotBrent com filtros de tendência, operacional de 10 e 15 minutos.
Indicator
AI
ATR
+23
The ZigZag Trend is a market structure tool that filters out small price fluctuations and highlights major swing.
Indicator
ADX
ATR
+2
GOLD SENTINEL v1.0 - A CANDLE-COLORING INDICATOR FOR GOLD.
Indicator
Candle Timer & Strength Panel for cTrader Description: Candle Timer & Strength Panel is an advanced, always-visible over
Indicator
Color-Based Market Pressure & Volatility Visualizer The Kandika Heatmap Indicator
Indicator
Forex
BTCUSD
+6
All-In-One solution for ICT's FVG IFVG ORDERBLOCK in advanced mode.
Indicator
AI
SMC
+14
Refined cleaner version of Key Levels indicator with broker UTC offset, styles & label alignment.
Indicator
ATR
Forex
+1
Trade fearlessly: auto-adjusts order blocks, manages risks, and ensures precision. Free for early users.
Indicator
Fisher Transform with smoothing. Spot reversals and cycles with precision. Great for any market, any timeframe.
Indicator
Forex
Indices
+1
Professional Fair Value Gaps with multitimeframe spot on
Indicator
Forex
EURUSD
+5
Fimathe Indicator - Fimathe PCM - Automated Trend Channels & Levels — Ideal for live trading and backteting
Indicator
Pin Bar
Inducement
+5
Institutional Nasdaq Session Liquidity Map with Live Point HUD, Sweep Alerts & Interactive Playbook.
Indicator
RSI
Stochastic
+2
Composite mean-reversion oscillator merging Z-Score, RSI & Bollinger %B into one clear overbought/oversold signal.
Indicator
Breakout
Institutional Flow Radar scans the chart for abnormal volume events and classifies them into two groups: Capital &Public
Indicator
Imbalance
Fair Value Gap
+1
Multi-symbol, multi-timeframe Fair Value Gaps in one panel.

Price

Since 29/11/2024
36
Sales
1.13K
Free installs