
설명
Jurik 평활화는 3단계로 구성됩니다:
1단계 - 적응형 EMA에 의한 예비 평활화: MA1 = (1-alpha)*Price + alpha*MA1[1];
2단계 - 칼만 필터에 의한 추가 예비 평활화: Det0 = (Price - MA1)*(1-beta) + beta*Det0[1]; MA2 = MA1 + PR*Det0;
3단계 - 독특한 Jurik 적응 필터에 의한 최종 평활화: Det1 = (MA2 - JMA[1]) * (1-alpha)^2 + alpha^2 * Det1[1]; JMA = JMA[1] + Det1;
여기서: - Price - 가격 시리즈 - alpha - 동적 인자(아래에서 설명) - beta - 주기 비율 = 0.45*(Length-1)/(0.45*(Length-1)+2) - PR - 위상 비율: PR = Phase/100 + 1.5 (Phase < -100이면 PR=0.5, Phase > 100이면 PR=2.5).
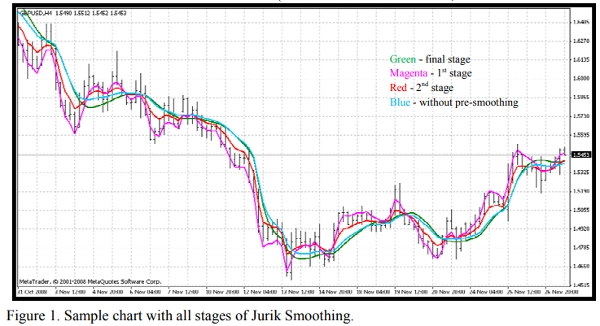
그림 1. Jurik 평활화의 모든 단계를 포함한 샘플 차트. 첨부된 지표 JurikFilter_v2를 사용하여 FilterMode를 변경함으로써 각 단계의 결과(그림 1)를 볼 수 있습니다: 0 - 최종 단계(JMA) 1 - 1단계 2 - 2단계 3 - 예비 단계 없이 최종 평활화만.
동적 인자는 주기 인자(beta)를 거듭제곱(pow)한 값입니다:
alpha = beta ^ Pow,
여기서: - pow = rVolty ^ pow1 - rVolty - 상대 가격 변동성 - pow1 - 다음 공식에 따른 상대 변동성의 거듭제곱: pow1 = len1 - 2 (pow1 < 0.5이면 pow1 = 0.5),
여기서 len1 - 추가 주기 인자: len1 = Log(SquareRoot(len))/Log(2.0) + 2 (len1 < 0이면 len1 = 0).
따라서 동적 인자는 상대 가격 변동성을 기반으로 하여 이 가격 필터 유형에 필요한 적응성을 제공합니다.
상대 가격 변동성 공식은 rVolty = Volty/AvgVolty (rVolty > len1^(1/pow1)이면 rVolty = len1^(1/pow1), rVolty < 1이면 rVolty = 1),
여기서:
- Volty - 소위 Jurik 밴드(VisualMode = 1) 계산에 기반한 가격 변동성.
- AvgVolty - Jurik가 복잡한 계산 알고리즘을 사용하는 평균 변동성: AvgVolty = Average(vSum,AvgLen),
여기서:
- vSum - (Volty - Volty[10])/10의 누적 합;
- AvgLen - 평균 기간 (Jurik는 65를 사용).
제 Jurik 필터 버전에서는 Jurik의 복잡한 평균 대신 단순 평균을 사용합니다
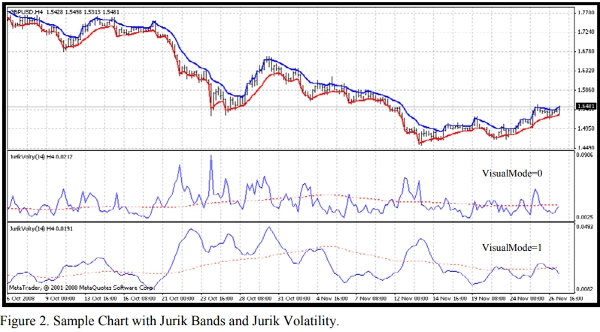
또한 첨부된 지표 JurikVolty_v1(그림 2)를 통해 Volty (VisualMode=0), vSum (VisualMode=1) 및 AvgVolty(빨간 점선) 값을 볼 수 있습니다.
가격 변동성 공식은 Volty = Abs(del1)와 Abs(del2) 중 최대값이며, Abs(del1) = Abs(del2)일 경우 Volty = 0,
여기서: - del1 - 가격과 상단 밴드 간 거리 del1 = Price - UpperBand - del2 - 가격과 하단 밴드 간 거리 del2 = Price - LowerBand Jurik 밴드는 Bollinger, Keltner, Donchian, Fractal 등과 같은 알려진 가격 밴드와 다릅니다: del1 > 0이면 UpperBand = Price, 그렇지 않으면 UpperBand = Price - Kv*del1 del2 < 0이면 LowerBand = Price, 그렇지 않으면 LowerBand = Price - Kv*del2,
여기서: - Kv - 변동성 인자 Kv = bet ^ SquareRoot(pow2). 이 밴드들은 Wilder의 Parabolic과 같은 추세 추종 지표의 기초가 될 수 있음을 쉽게 알 수 있습니다. 따라서 Jurik 이동 평균(JMA) 알고리즘에는 모호한 부분이 거의 없음을 알 수 있습니다
요약
고객 리뷰
5 | 0 % | |
4 | 100 % | |
3 | 0 % | |
2 | 0 % | |
1 | 0 % |


