
설명
정밀하고 자신감 있게 거래 종료를 최적화할 수 있는 궁극의 도구인 샹들리에 종료 지표를 소개합니다.
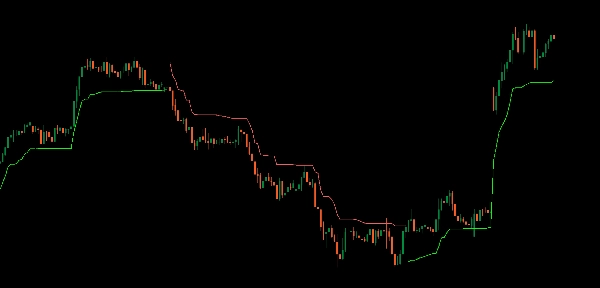
이 지표는 최고가와 ATR을 기반으로 동적으로 손절 지점을 계산하여 차트에 실시간으로 명확한 시각적 신호를 제공합니다.
이익을 확정하고 시장 반전에 대비할 수 있도록 설계된 샹들리에 종료는 항상 한발 앞서 나갈 수 있게 도와줍니다.
신뢰할 수 있는 종료 신호로 전략을 강화하려는 트레이더에게 완벽한 이 지표는 위험 관리를 위한 직관적이고 시각적인 접근법을 제공합니다. 거래 도구를 업그레이드하고 샹들리에 종료로 수익을 안전하게 확보하세요.
요약
AI 요약
The Chandelier Exit indicator dynamically calculates stop-loss levels based on the highest high price and the Average True Range (ATR). It provides real-time visual cues on trading charts to help traders optimize exit points, lock in profits, and protect against market reversals. Suitable for various markets including Forex, cryptocurrencies, stocks, commodities, and indices, it supports symbols such as BTCUSD, EURUSD, GBPUSD, XAUUSD, NAS100, and USDJPY. The indicator offers a straightforward, visual method for managing risk and enhancing trading strategies by signaling reliable exit points.
지표 프로필
고객 리뷰
4.3
리뷰: 3
5 | 33 % | |
4 | 67 % | |
3 | 0 % | |
2 | 0 % | |
1 | 0 % |
고객 리뷰
October 9, 2025
Decent tool for testing if the trader wants it keeps trade control closer to the plan. It works best as support, not a final decision maker. The best use is 1 percent risk per trade, BE after 1R and partials near 1.5R. incorrect settings can give a false sense of safety.
October 8, 2025
October 8, 2025
Useful extra check for traders who care about risk before entries. It gives value around risk management, but incorrect settings can give a false sense of safety. I would check 30 trades and compare DD before and after the tool, aiming for less than 3 percent monthly DD. It is useful when the trader already respects stops and sizing.
상담
자주 묻는 질문(FAQ)
BTCUSD
Forex
Signal
Indices
EURUSD
Commodities
GBPUSD
NZDUSD
Prop
Scalping
Crypto
Stocks
XAUUSD
NAS100
ATR
USDJPY
트레이딩 봇, 지표, 플러그인 등 cTrader Store에서 제공되는 상품은 제3자 개발자에 의해 제공되며, 이는 단순히 정보 및 기술적 접근을 목적으로 제공된 것입니다. cTrader Store는 중개인이 아니며, 투자 조언, 개인별 추천 또는 향후 성과에 대한 어떠한 보장도 제공하지 않습니다.


가격
가입일 25/09/2025
25
판매
315
무료 설치