
설명
The UT Bot 은 잠재적인 추세 반전과 모멘텀 변화를 식별하기 위한 인기 있고 매우 사용자 정의 가능한 기술적 분석 지표입니다. 가격 차트에 명확한 진입 및 종료 신호를 직접 표시하여 거래 결정을 단순화하도록 설계되었습니다.
주요 특징 및 구성 요소
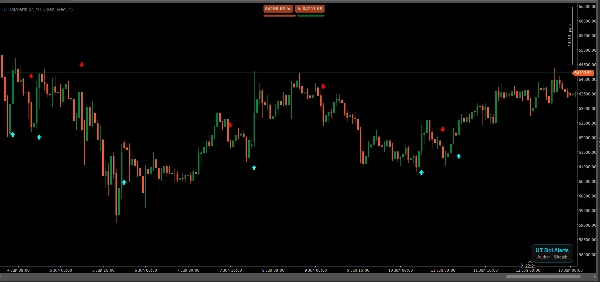
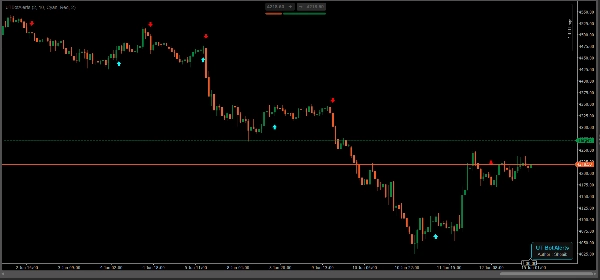
- 매수 및 매도 신호: 이 지표는 녹색 "BUY" (상승) 화살표와 빨간색 "SELL" (하락) 화살표를 표시하여 잠재적인 추세 변화를 강조합니다. 차트에서 볼 수 있듯이, 시장 하락 시작 시 매도 신호가 나타나고 모멘텀이 상승으로 전환될 때 매수 신호가 발생합니다.
- 추세 추적: 거래자가 하락 추세 (기준선 아래로 움직이는 약세 가격 움직임)와 상승 추세 (상승하는 강세 가격 움직임)를 시각적으로 구분하는 데 도움을 줍니다.
- 캔들스틱 통합: 신호는 표준 캔들스틱 가격 차트 위에 원활하게 오버레이되어 봇이 작동하는 정확한 가격 수준을 쉽게 확인할 수 있습니다.
- 변동성 기반 민감도: UT Bot은 일반적으로 평균 진폭 범위(ATR)와 추적 정지 메커니즘의 조합에 의존하여, 거래자가 시장 소음을 걸러내거나 장기 추세를 포착하기 위해 민감도를 조절할 수 있도록 합니다.
요약
AI 요약
UTBotAlerts is a technical analysis indicator designed to identify potential trend reversals and momentum shifts in financial markets. It visually signals buy and sell opportunities by plotting green "BUY" arrows and red "SELL" arrows directly on candlestick price charts, aiding traders in recognizing entry and exit points. The indicator distinguishes between uptrends and downtrends by tracking price action relative to a baseline, helping users interpret market direction clearly. UTBotAlerts incorporates volatility-based sensitivity adjustments using the Average True Range (ATR) combined with a trailing stop mechanism, allowing customization to filter market noise or capture longer-term trends. This indicator supports trend analysis and overlays seamlessly on standard price charts, enhancing decision-making through clear, actionable signals.
지표 프로필
지표 카테고리
추세
출력 유형
신호
데이터 요구 사항
막대만
지원되는 신호
추세 강도
고객 리뷰
5.0
리뷰: 1
5 | 100 % | |
4 | 0 % | |
3 | 0 % | |
2 | 0 % | |
1 | 0 % |
고객 리뷰
June 29, 2026
UT Bot Alerts is a lightweight and stable implementation of the classic ATR-based trend reversal indicator. It provides clean BUY/SELL signals, adapts well to changing volatility conditions and works consistently across Forex and Gold markets. Its simplicity and reliability make it particularly useful as a trend filter or confirmation tool.
상담
자주 묻는 질문(FAQ)
Supertrend
Volume
ATR
트레이딩 봇, 지표, 플러그인 등 cTrader Store에서 제공되는 상품은 제3자 개발자에 의해 제공되며, 이는 단순히 정보 및 기술적 접근을 목적으로 제공된 것입니다. cTrader Store는 중개인이 아니며, 투자 조언, 개인별 추천 또는 향후 성과에 대한 어떠한 보장도 제공하지 않습니다.


가격
가입일 04/09/2025
1
판매