
คำอธิบาย
คู่มือผู้ใช้ WinSMC
1. วัตถุประสงค์
`WinSMC` เป็นตัวบ่งชี้ SMC แบบโอเวอร์เลย์สำหรับ cTrader ช่วยให้คุณระบุได้ด้วยสายตา:
- การเปลี่ยนแปลงโครงสร้างตลาด
- `BOS` (Break of Structure)
- `MSS` (Market Structure Shift)
- `Order Blocks`
- `Liquidity Grabs` / `Sweeps`
- `FVG` (Fair Value Gaps)
มันไม่ใช่ระบบเทรดอัตโนมัติ แต่เป็นเครื่องมือโครงสร้างและบริบทที่เหมาะสำหรับการเทรดแบบยืนยันสัญญาณ
2. แนวคิดหลัก
ความยาวสวิง (Swing Length)
`Swing Length` ควบคุมว่าจุดหมุน (pivot) ต้องได้รับการยืนยันทางซ้ายและขวามากแค่ไหนก่อนที่จะถือว่าเป็นจุดสวิงที่ถูกต้อง
คำแนะนำเชิงปฏิบัติ:
- ค่าที่เล็กกว่า = สัญญาณมากขึ้น, มีเสียงรบกวนมากขึ้น
- ค่าที่ใหญ่กว่า = สัญญาณน้อยลง, โครงสร้างชัดเจนขึ้น
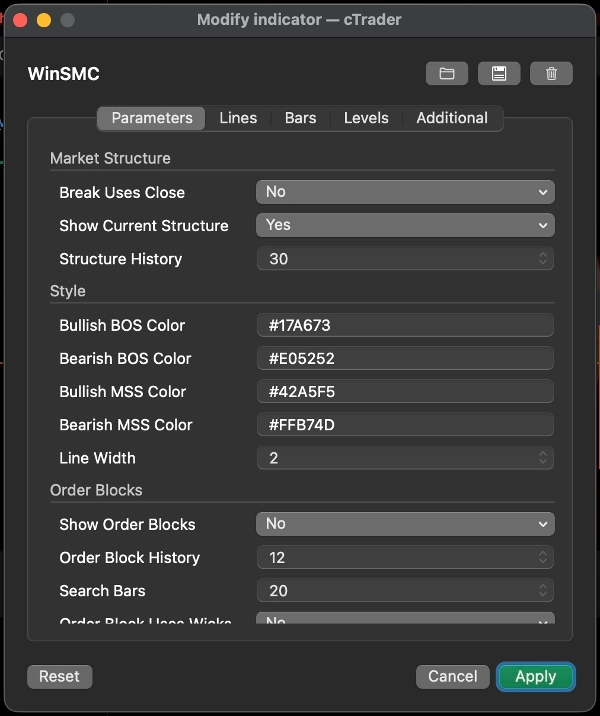
การยืนยันการเบรกด้วยราคาปิด (Break Uses Close)
การตั้งค่านี้กำหนดว่าการเบรกโครงสร้างจะได้รับการยืนยันโดย:
- `ใช่`: ราคาปิดแท่งเทียน
- `ไม่`: การเบรกที่ไส้เทียน/ต่ำสุด/สูงสุด
คำแนะนำ:
- ใช้ราคาปิดเพื่อความระมัดระวังมากขึ้น
- ใช้การเบรกไส้เทียนเพื่อการตรวจจับที่ไวและเร็วขึ้น
แสดงโครงสร้างปัจจุบัน (Show Current Structure)
แสดงเส้นสวิงสูงและสวิงต่ำที่ใช้งานอยู่ในปัจจุบัน ช่วยให้คุณเห็นว่าสตลาดยังคงเคารพอะไรอยู่
ประวัติโครงสร้าง (Structure History)
ควบคุมจำนวนเส้นเบรกโครงสร้างและป้ายที่เก็บไว้บนกราฟ
3. BOS และ MSS
BOS
`BOS` หมายถึงราคายังคงเคลื่อนที่ในทิศทางเดียวกันและทำลายจุดสูงหรือต่ำก่อนหน้า
การตีความทั่วไป:
- ในแนวโน้มขาขึ้น การทำลายจุดสูงก่อนหน้าเป็น BOS แบบกระทิง
- ในแนวโน้มขาลง การทำลายจุดต่ำก่อนหน้าเป็น BOS แบบหมี
MSS
`MSS` หมายถึงตลาดเปลี่ยนทิศทางจากความเอนเอียงก่อนหน้า
การตีความทั่วไป:
- หากราคากำลังเป็นขาลงและทำลายจุดสูงก่อนหน้า นั่นคือ MSS แบบกระทิง
- หากราคากำลังเป็นขาขึ้นและทำลายจุดต่ำก่อนหน้า นั่นคือ MSS แบบหมี
การใช้งานในการเทรด
- `BOS` มุ่งเน้นไปที่การต่อเนื่องของแนวโน้ม
- `MSS` มุ่งเน้นไปที่การกลับตัว
- การเข้าที่ดีที่สุดมักมาจากการทดสอบซ้ำของ `Order Block` หรือ `FVG`
4. บล็อกคำสั่ง (Order Blocks)
`Order Block` คือแท่งเทียนตรงข้ามแท่งสุดท้ายก่อนการเบรกโครงสร้าง มักถูกใช้เป็นโซนปฏิกิริยาซัพพลาย/ดีมานด์
แสดงบล็อกคำสั่ง (Show Order Blocks)
เมื่อเปิดใช้งาน ตัวบ่งชี้จะย้อนกลับไปหลังจาก `BOS` หรือ `MSS` และวาดโซนแท่งเทียนตรงข้ามแท่งสุดท้าย
ความหมาย
- OB แบบกระทิง: หลังจากเบรกแบบกระทิง ใช้แท่งเทียนแบบหมีแท่งสุดท้าย
- OB แบบหมี: หลังจากเบรกแบบหมี ใช้แท่งเทียนแบบกระทิงแท่งสุดท้าย
เมื่อราคามีปฏิสัมพันธ์กับโซน จะถูกทำเครื่องหมายว่าได้รับการบรรเทาแล้ว
Order Block ใช้ไส้เทียน (Order Block Uses Wicks)
สิ่งนี้ควบคุมความกว้างของกล่องที่วาด:
- `ใช่`: ใช้ช่วงแท่งเทียนทั้งหมด โซนกว้างขึ้น
- `ไม่`: ใช้โซนแกนกลางที่แคบกว่า
คำแนะนำ:
- ใช้ `ใช่` สำหรับโซนที่กว้างและระมัดระวังมากขึ้น
- ใช้ `ไม่` สำหรับโซนที่แคบและแม่นยำมากขึ้น
กลยุทธ์ Order Block
ขั้นตอนทั่วไป:
1. รอ `BOS` หรือ `MSS`
2. ทำเครื่องหมาย OB ที่เกี่ยวข้อง
3. รอการทดสอบซ้ำ
4. มองหาการยืนยันก่อนเข้าเทรด
อย่าถือว่า OB เป็นจุดกลับตัวที่รับประกันได้ มันเป็นพื้นที่ที่มีความสนใจสูง ไม่ใช่ความแน่นอน
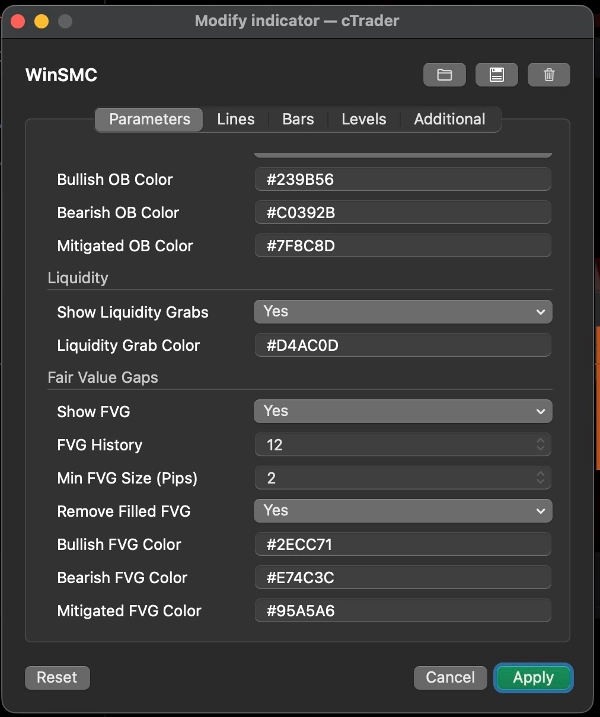
5. Liquidity Grabs / Sweeps
`Liquidity Grab` หมายถึงราคาวิ่งขึ้นเหนือจุดสูงก่อนหน้าหรือวิ่งต่ำกว่าจุดต่ำก่อนหน้า แล้วปิดกลับเข้ามาภายใน
ในตัวบ่งชี้นี้:
- `Buy-side sweep`: ราคาทำลายจุดสูงก่อนหน้าแล้วปิดต่ำกว่าจุดนั้น
- `Sell-side sweep`: ราคาทำลายจุดต่ำก่อนหน้าแล้วปิดสูงกว่าจุดนั้น
โดยทั่วไปหมายความว่าตลาดได้ดึงสภาพคล่องและอาจเตรียมพร้อมสำหรับการเคลื่อนไหวถัดไป
สิ่งสำคัญ
การสวิงเพียงอย่างเดียวไม่ใช่สัญญาณเทรด
ควรถือเป็น:
- การเตือนว่าสภาพคล่องถูกดึงไปแล้ว
- เป็นสัญญาณเตรียมการ
- เหตุผลในการรอ `MSS` หรือ `BOS`
การใช้งานทั่วไป
- หลังจาก `Buy-side sweep` การเกิด `MSS` แบบหมีสามารถสนับสนุนการตั้งค่าการขาย
- หลังจาก `Sell-side sweep` การเกิด `MSS` แบบกระทิงสามารถสนับสนุนการตั้งค่าการซื้อ
6. FVG
`FVG` คือช่องว่างมูลค่ายุติธรรมที่เกิดจากความไม่สมดุลของแท่งเทียนสามแท่ง
แสดง FVG
เมื่อเปิดใช้งาน ตัวบ่งชี้จะวาดโซน FVG ที่มองเห็นได้
กฎการตรวจจับ
- FVG แบบกระทิง: จุดสูงแท่งแรกต่ำกว่าจุดต่ำแท่งที่สาม
- FVG แบบหมี: จุดต่ำแท่งแรกสูงกว่าจุดสูงแท่งที่สาม
ขนาดขั้นต่ำของ FVG (Pips)
ตัวกรองช่องว่างขนาดเล็ก
- หน่วย: `pips`
- ค่าสูง = FVG น้อยลงแต่มีความหมายมากขึ้น
- `0` = ไม่มีตัวกรองขนาด
มีประโยชน์เมื่อกราฟรกหรือช่องว่างเล็กๆ 1 พิกเซลไม่เหมาะกับการทำงานของคุณ
ลบ FVG ที่เติมเต็มแล้ว
เมื่อเปิดใช้งาน FVG ที่เติมเต็มเต็มที่จะถูกลบออกจากกราฟ
กลยุทธ์ FVG
สองวิธีที่ใช้บ่อย:
1. การย้อนกลับของแนวโน้ม
- รอ `BOS` หรือ `MSS`
- รอให้ราคาย้อนกลับเข้าสู่ FVG
- เทรดตามทิศทางของโครงสร้าง
2. การเข้าตามการยืนยัน
- รอดูการสวิง
- รอ `MSS`
- ใช้ FVG เป็นโซนย้อนกลับขั้นสุดท้าย
7. สไตล์การเทรดที่แนะนำ
กลยุทธ์ A: การต่อเนื่องของแนวโน้ม
เหมาะที่สุดเมื่อตลาดมีแนวโน้มชัดเจน
ขั้นตอนการทำงาน:
1. รอ `BOS`
2. ทำเครื่องหมาย OB
3. มองหาการย้อนกลับเข้าสู่ OB หรือ FVG
4. เข้าเทรดหลังจากราคาตอบสนองเท่านั้น
นี่คือวิธีการติดตามแนวโน้มแบบคลาสสิก
กลยุทธ์ B: สวิงแล้วกลับตัว
เหมาะที่สุดเมื่อตลาดผันผวนและมีแนวโน้มเบรกเท็จ
ขั้นตอนการทำงาน:
1. ตรวจจับ `Buy-side sweep` หรือ `Sell-side sweep`
2. รอ `MSS` ตรงข้าม
3. ใช้ OB หรือ FVG เป็นโซนย้อนกลับ
4. เข้าเทรดหลังการยืนยัน
วิธีนี้แข็งแกร่งกว่าการเทรดสวิงเพียงอย่างเดียว
กลยุทธ์ C: สวิง + MSS + การรวม OB/FVG
นี่คือหนึ่งในวิธีที่สะอาดที่สุดในการใช้ตัวบ่งชี้
ขั้นตอนการทำงาน:
1. ได้รับสวิง
2. ได้รับ MSS
3. รอการทดสอบซ้ำ OB หรือ FVG
4. เทรดเฉพาะเมื่อโซนทับซ้อนกัน
วิธีนี้ช่วยลดการเข้าที่เร็วเกินไป
8. คำแนะนำการตั้งค่าอย่างรวดเร็ว
- `Swing Length`: เริ่มต้นที่ 5 หรือ 7
- `Break Uses Close`: เปิดเพื่อมุมมองที่ระมัดระวังมากขึ้น
- `Order Block Uses Wicks`: เปิดเพื่อโซนที่กว้างขึ้น
- `Min FVG Size (Pips)`: เริ่มต้นที่ 2.0 และปรับตามเครื่องมือ
- `Structure History` / `Order Block History` / `FVG History`: ปรับเพื่อให้กราฟอ่านง่าย
9. หมายเหตุสุดท้าย
`WinSMC` เหมาะสำหรับใช้เป็นแผนที่โครงสร้าง ไม่ใช่ตัวกระตุ้นสัญญาณเดียว
ขั้นตอนการทำงานที่น่าเชื่อถือที่สุดคือ:
- ระบุทิศทางแนวโน้ม
- รอดูการสวิงสภาพคล่อง
- รอ MSS หรือ BOS
- ใช้ OB หรือ FVG เป็นโซนเข้าเทรด
- เข้าเทรดหลังจากได้รับการยืนยันเท่านั้น
สรุป
The indicator helps traders analyze price action by marking swing highs and lows, confirming valid swing points based on customizable swing length, and distinguishing breaks using candle closes or wick extremes. Order Blocks are displayed as supply/demand zones derived from the last opposite candle before a structure break, with options to adjust zone width. Liquidity Sweeps indicate price movements beyond prior highs or lows that close back inside, signaling potential setups rather than direct trade signals. FVG zones are identified by three-candle imbalances and can be filtered by minimum size and removed once filled.
WinSMC supports multiple trading strategies, including trend continuation after BOS, reversal setups following liquidity sweeps and MSS, and confluence-based entries combining sweeps, MSS, and retests of Order Blocks or FVGs. It is intended as a confirmation and structure mapping tool rather than an automated trading system, aiding traders in timing entries with contextual market information.

!["[CB] Pivot Points Pro" โลโก้](https://cdn.ctrader.com/image/webp/43463c82-67b0-4f10-a4ba-901bba091d81_32594)


