
Liquidity Cluster Order
지표
2 구매
버전 1.0, Nov 2025
Windows, Mac
5.0
리뷰: 1
설명
유동성 클러스터 주문 (LCO) 🔍💧
1. LCO가 보여주는 것
유동성 클러스터 주문은 자동으로 감지하고 그립니다:
- 강세 유동성 클러스터 (잠재적 수요 / 축적 구역) ✅
- 약세 유동성 클러스터 (잠재적 공급 / 분배 구역) 🔻
각 클러스터는:
- 볼륨 피벗 바에 고정되어 있습니다 (볼륨의 국소 최대값),
- 최근 가격 확장에 따라 강세 또는 약세로 분류됩니다,
- 가격이 클러스터를 소멸(소비)할 때까지 시간적으로 연장됩니다.
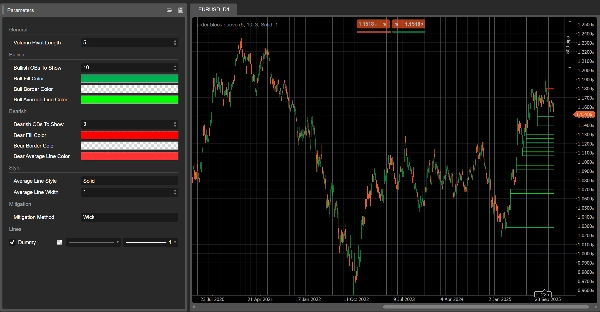
차트에서 보이는 것:
- 녹색 사각형 → 강세 유동성 클러스터
- 빨간색 사각형 → 약세 유동성 클러스터
- 각 사각형 내부의 회색 선 → 해당 클러스터의 평균 가격 수준
클러스터가 소멸된 것으로 간주되면, 차트에서 사라지고 활성 클러스터만 남습니다.
2. 감지 논리 (간단히)
- 볼륨 피벗
-
- LCO는 볼륨이 이전과 다음
Volume Pivot Length바보다 높은 바를 스캔합니다. - 이 바들은 볼륨 피벗입니다 – 유동성 클러스터의 잠재적 고정점입니다.
- LCO는 볼륨이 이전과 다음
- 컨텍스트: 강세 대 약세
-
- 최근 가격 움직임이 컨텍스트를 정의합니다:
-
- 강세 컨텍스트 → 하락 확장이 지배적이었습니다.
- 약세 컨텍스트 → 상승 확장이 지배적이었습니다.
- 이 컨텍스트는 다음 볼륨 피벗이 강세 또는 약세 유동성 클러스터를 생성할지 결정합니다.
- 강세 유동성 클러스터
강세 컨텍스트에서: -
- 클러스터 하단 = 피벗 바의 저가
- 클러스터 상단 = 바의 중간 지점 (
(고가 + 저가) / 2) - 해석: 하락 압력이 흡수되고 매수자가 적극적으로 개입한 구역.
- 약세 유동성 클러스터
약세 컨텍스트에서: -
- 클러스터 하단 = 피벗 바의 중간 지점
- 클러스터 상단 = 피벗 바의 고가
- 해석: 상승 압력이 흡수되고 매도자가 통제권을 잡은 구역.
- 평균선
-
- 각 클러스터에 대해 LCO는 상단과 하단의 평균을 계산하고 회색 중간선을 그립니다.
- 이는 클러스터의 내부 균형 수준 역할을 합니다.
- 소멸 (클러스터 소비)
새로운 바마다 LCO는 클러스터가 소멸되었는지 확인합니다: -
- 강세 클러스터의 경우:
-
- 최근
Volume Pivot Length바 동안 하락 목표 가격을 추적합니다: -
Mitigation Method = Wick→ 최저 저가.Mitigation Method = Close→ 최저 종가.
- 이 목표 가격이 클러스터 하단 아래로 내려가면, 강세 클러스터는 소멸된 것으로 간주되어 제거됩니다.
- 최근
- 약세 클러스터의 경우:
-
- 상승 목표 가격을 추적합니다:
-
Wick→ 최고 고가.Close→ 최고 종가.
- 이 목표 가격이 클러스터 상단 위로 올라가면, 약세 클러스터는 소멸된 것으로 간주되어 제거됩니다.
소멸됨 = 해당 클러스터의 유동성이 소비/무효화된 것으로 간주됩니다.
3. 차트에서 LCO 읽는 방법
주로 보게 될 것은:
- 가격 아래의 녹색 클러스터 → 잠재적 수요 유동성 구역
- 가격 위의 빨간 클러스터 → 잠재적 공급 유동성 구역
일반적인 해석 (거래 조언 아님):
- 신규 클러스터
-
- 최근 생성된 클러스터가 더 관련성이 높을 때가 많습니다:
-
- 가격 아래의 강세 클러스터 → 매수자가 마지막으로 매도 압력을 흡수한 구역.
- 가격 위의 약세 클러스터 → 매도자가 마지막으로 매수 압력을 흡수한 구역.
- 클러스터 재시험
-
- 가격이 강세 클러스터를 위에서 다시 방문할 때:
-
- 가격이 반응하여 하단을 지키면 → 가능한 반등 / 롱 반응 구역.
- 가격이 약세 클러스터를 아래에서 다시 방문할 때:
-
- 가격이 상단 위로 거래하지 못하면 → 가능한 거부 / 숏 반응 구역.
- 소멸된 클러스터 대 활성 클러스터
-
- 가격이 선택된 소멸 방법에 따라 클러스터 경계를 뚫고 지나가면,
→ 해당 유동성 클러스터는 이후 바에서 제거됩니다. - 아직 보이는 클러스터는 완전히 거래되지 않은 활성 유동성 구역입니다.
- 가격이 선택된 소멸 방법에 따라 클러스터 경계를 뚫고 지나가면,
- 중간선 사용법
-
- 그 회색 중간선은 다음과 같이 사용할 수 있습니다:
-
- 클러스터 내부에서 이익 실현 또는 부분 청산 수준,
- 유동성 구역 내의 “공정 가격” 기준,
- 가격이 클러스터의 상단 또는 하단 절반에서 거래되는지 빠르게 확인하는 방법.
4. 매개변수 (영어)
볼륨 피벗 길이
- 다음 용도로 사용되는 바:
-
- 볼륨 피벗 감지,
- 극값 및 소멸 목표 계산.
- 낮은 값 → 클러스터 많음, 노이즈 많음;
- 높은 값 → 적고 더 중요한 클러스터.
표시할 강세 유동성 클러스터
(이전의 표시할 강세 OB)
- 차트에 표시할 최대 강세 클러스터 수.
표시할 약세 유동성 클러스터
(이전의 표시할 약세 OB)
- 표시할 최대 약세 클러스터 수.
강세/약세 채우기 색상
- 강세/약세 클러스터의 채우기 색상.
- 알파(투명도) 값 포함 가능.
강세/약세 평균선 색상
- 각 클러스터 내부 중간선의 색상.
평균선 스타일
- 중간선의 시각적 스타일:
"Solid","Dashed","Dotted".
평균선 두께
- 중간선의 두께.
소멸 방법
"Wick"→ 고가/저가 심지를 기반으로 한 소멸 (더 민감함)."Close"→ 종가를 기반으로 한 소멸 (더 보수적임).
요약
AI 요약
Liquidity Cluster Order (LCO) is a trading indicator that automatically identifies and visualizes key liquidity zones on price charts. It detects bullish liquidity clusters (potential demand or accumulation zones) and bearish liquidity clusters (potential supply or distribution zones) by anchoring each cluster on volume pivot bars—local volume maxima—and classifies them based on recent price extensions.
On the chart, bullish clusters appear as green rectangles below the price, indicating areas where buyers absorbed selling pressure. Bearish clusters are shown as red rectangles above the price, marking zones where sellers absorbed buying pressure. Each cluster includes a grey mid-line representing the average price level, serving as an internal equilibrium reference.
Clusters extend forward in time until price "mitigates" or consumes them, at which point they disappear, leaving only active liquidity zones visible. Mitigation is determined by tracking price extremes (high/low wicks or closing prices) over a configurable number of bars.
Key parameters include the volume pivot length (defining sensitivity and cluster significance), maximum clusters displayed, cluster colors, mid-line style, and mitigation method. LCO supports various markets including forex, indices, commodities, stocks, and cryptocurrencies, and integrates with multiple trading strategies and indicators such as RSI, MACD, Bollinger Bands, and Fibonacci levels.
지표 프로필
고객 리뷰
5.0
리뷰: 1
5 | 100 % | |
4 | 0 % | |
3 | 0 % | |
2 | 0 % | |
1 | 0 % |
고객 리뷰
November 18, 2025
Two timeframes give more context. The first signal should not decide the only input.
상담
자주 묻는 질문(FAQ)
Signal
Indices
Commodities
GBPUSD
RSI
Bollinger
Fibonacci
Scalping
AI
XAUUSD
NAS100
MACD
BTCUSD
Forex
Breakout
EURUSD
NZDUSD
Martingale
Prop
Supertrend
Fair Value Gap
SMC
Crypto
Grid
Stocks
ATR
USDJPY
VWAP
트레이딩 봇, 지표, 플러그인 등 cTrader Store에서 제공되는 상품은 제3자 개발자에 의해 제공되며, 이는 단순히 정보 및 기술적 접근을 목적으로 제공된 것입니다. cTrader Store는 중개인이 아니며, 투자 조언, 개인별 추천 또는 향후 성과에 대한 어떠한 보장도 제공하지 않습니다.


가격
42.11M
거래량
6.13M
핍 수익
222
판매
8.39K
무료 설치