Descrição
Análise de tendência adaptativa usando matemática de regressão ponderada por kernel.
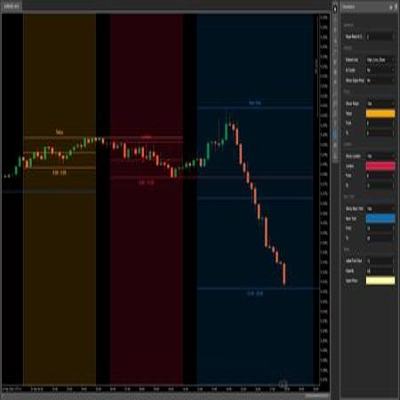
Aplica ponderação por kernel Gaussiano onde barras próximas influenciam mais e barras distantes desaparecem exponencialmente, criando linhas de tendência ultra suaves sem atraso de período fixo.
Ajuste automático à estrutura local de preços, atraso mínimo comparado às médias móveis tradicionais, codificação dinâmica de cores (Verde-limão para tendência de alta, Vermelho para tendência de baixa), largura de banda ajustável para ajuste de responsividade, janela de retrocesso flexível (50-2000 barras) e design bicolor livre de ruído proporcionam identificação de tendência matematicamente precisa para traders que buscam suavização adaptativa sem seleção arbitrária de período.
RECURSOS
Cálculo Ponderado por Kernel
- Barras próximas influenciam mais, barras distantes desaparecem exponencialmente—sem períodos fixos arbitrários
- Ponderação por kernel Gaussiano para suavização matematicamente ótima
- Ajusta-se automaticamente à estrutura local de preços sem recalibração manual
- Atraso mínimo: responde mais rápido a mudanças genuínas de tendência do que médias móveis equivalentes
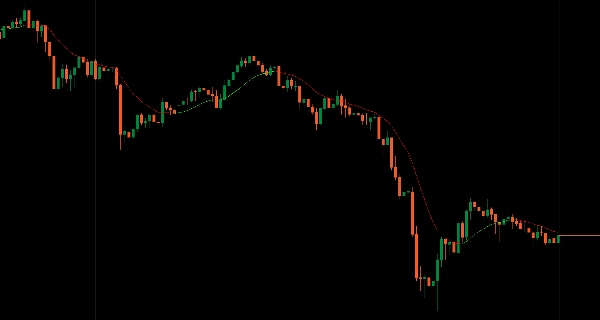
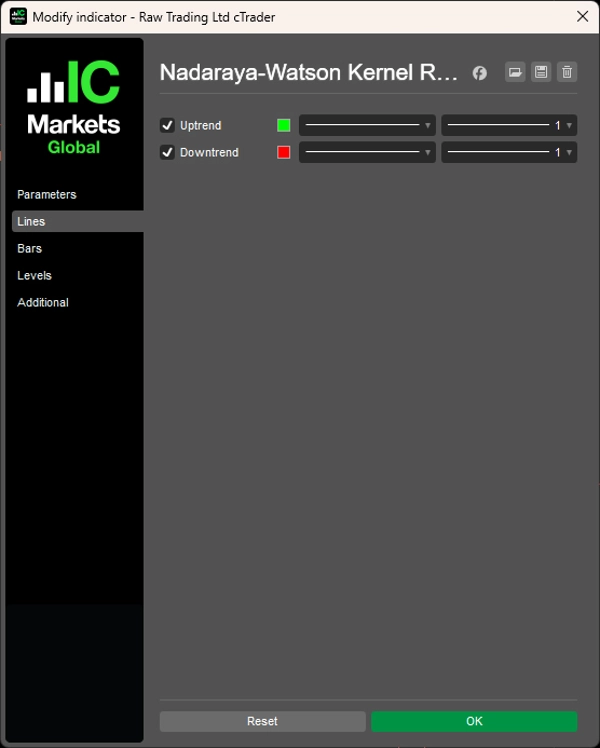
Codificação Dinâmica de Cores
- Verde-limão: Tendência de alta
- Vermelho: Tendência de baixa
- Confirmação visual instantânea da direção da tendência
- Exibição de linha descontínua: mudanças de cor são instantâneas e visualmente claras
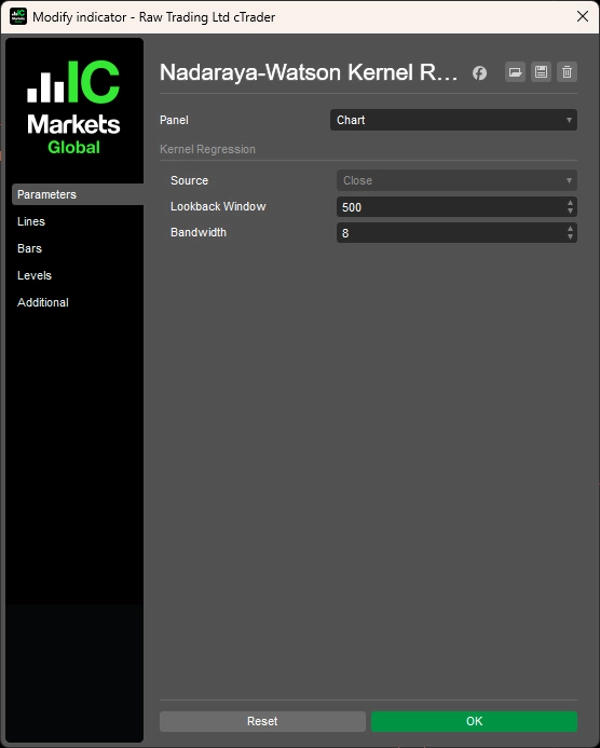
Parâmetros Ajustáveis
- Largura de banda: ajuste fino da responsividade versus suavidade
- Janela de retrocesso flexível: 50-2000 barras para combinar com seu período de tempo
- Adapta-se a diferentes condições de mercado e estilos de negociação
Design Limpo
- Duas cores, zero desordem—tendendo para cima ou para baixo
- Identificação de tendência livre de ruído
- Nenhuma configuração complexa necessária
- Simplicidade visual com precisão matemática
__________________________________________________________________________________________
MAIS INDICADORES GRATUITOS
Explore uma ampla gama de ferramentas de análise de mercado—desde estrutura e volume até regressão, volatilidade e períodos personalizados.
O código-fonte está disponível no repositório do GitHub.
Todos gratuitos para uso. Mas se quiser enviar um apoio para café, você pode direcioná-lo aqui.
Suporte/Resistência
Volume
- Perfilador de Atividade de Volume
- Analisador de Eficiência de Volume
- Análise de Perfil de Volume
- Perfil de Volume - Atualizado
- Análise de Spread de Volume
- VWAP (Preço Médio Ponderado por Volume)
Médias Móveis
- Canal SSL
- Média Móvel Ancorada
- Média Móvel Escalonada por Desvio
- Ativador Gann High Low
- Linha de Tendência Instantânea
- Média Móvel Adaptativa Kaufman com Visão de Tendência
- Canal de Média Móvel
- Conjunto de Médias Móveis
- Média Móvel do Canal de Tendência
Utilitários/Personalizados
Baseado em Regressão
Volatilidade
Osciladores
__________________________________________________________________________________________
AVISO LEGAL
Negociar envolve riscos. Este indicador destina-se apenas à análise técnica — sempre aplique gerenciamento de risco adequado e negocie com responsabilidade.
FEEDBACK E MELHORIAS
Se você tiver sugestões, pedidos de recursos ou ideias para aprimoramento, por favor deixe um comentário na aba Discussão. Seu feedback ajuda a melhorar o indicador para todos.
Resumo
Key features include dynamic color coding with lime indicating uptrends and red indicating downtrends, offering instant visual confirmation of trend direction through a noise-free, two-color design. Users can fine-tune the indicator’s responsiveness and smoothness via adjustable bandwidth and select a flexible lookback window ranging from 50 to 2000 bars to suit various timeframes and market conditions.
The indicator emphasizes mathematical precision and visual simplicity, requiring no complex settings. It is designed for traders seeking an adaptive smoothing method for trend identification without arbitrary period selection. This tool supports scalping strategies and is part of a broader suite of market analysis indicators focused on regression, volume, volatility, and custom timeframes.
Avaliações de clientes
5 | 100 % | |
4 | 0 % | |
3 | 0 % | |
2 | 0 % | |
1 | 0 % |


![Logótipo de "Smart Money Concepts (SMC) [Iridio Capital]"](https://cdn.ctrader.com/image/webp/28b69fd1-ef54-4bed-9487-07e78e883be4_40934)


![Logótipo de "[Hamster-Coder] Bollinger Bands"](https://cdn.ctrader.com/image/webp/21d8e5d6-fb11-4bac-b9ee-cd05c2b76804_30327)