Descrição
VISÃO GERAL
A Linha de Tendência Instantânea é um indicador técnico desenvolvido por John Ehlers, um engenheiro elétrico que aplicou princípios de processamento digital de sinais (DSP) à análise do mercado financeiro. Originalmente publicado na revista Stocks & Commodities (fevereiro de 2002) e detalhado em seus livros "Rocket Science for Traders" e "Cybernetic Analysis for Stocks and Futures", este indicador isola o componente de tendência dos dados de preço filtrando os componentes cíclicos (oscilatórios).
CONCEITO
Ao contrário das médias móveis tradicionais que simplesmente suavizam os dados de preço, a Linha de Tendência Instantânea usa técnicas matemáticas derivadas da engenharia elétrica para decompor a ação do preço em dois componentes distintos:
- Componente de Tendência - A inclinação direcional do mercado
- Componente de Ciclo - As flutuações oscilatórias ao redor da tendência
Aplicando filtros notch e a metodologia da Transformada de Hilbert, Ehlers criou um indicador que responde rapidamente a mudanças genuínas de tendência enquanto filtra ruídos e ciclos de curto prazo. O resultado é uma linha de tendência que se adapta às condições do mercado com atraso significativamente reduzido em comparação com médias móveis simples ou exponenciais de períodos similares.
A principal vantagem dessa abordagem é a precisão matemática em separar o que é "tendência" do que é "ruído cíclico", ao invés de simplesmente fazer a média do preço em um período fixo de observação.
COMO FUNCIONA
O indicador calcula uma linha de tendência suavizada usando uma fórmula recursiva baseada no parâmetro Alpha. A fórmula incorpora:
- Dados de preço atuais e recentes (ponto médio HL/2)
- Valores anteriores da linha de tendência
- Coeficiente de suavização Alpha (padrão 0.07)
O indicador também gera uma linha Trigger, que é a Linha de Tendência Instantânea deslocada por 2 barras. Esta linha trigger é usada para gerar sinais de negociação através da lógica de cruzamento.
INTERPRETAÇÃO
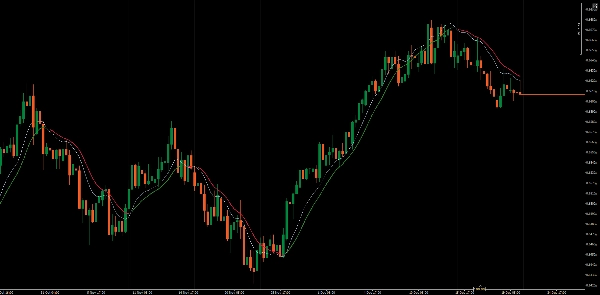
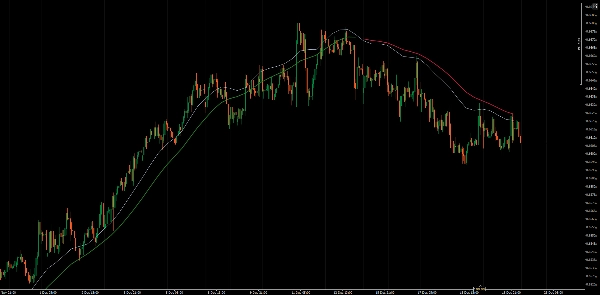
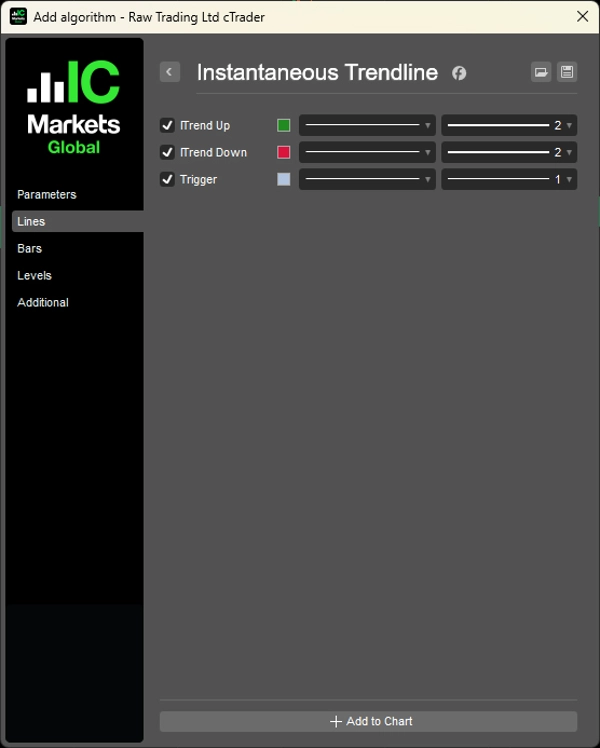
O indicador plota três linhas:
- ITrend Alta: Exibida quando Trigger > ITrend, indicando condições de alta
- ITrend Baixa: Exibida quando Trigger < ITrend, indicando condições de baixa
- Trigger: A versão da linha de tendência com atraso de 2 barras
Geração de Sinais:
- Sinal de Alta: Quando a linha Trigger cruza acima da Linha de Tendência Instantânea
- Sinal de Baixa: Quando a linha Trigger cruza abaixo da Linha de Tendência Instantânea
A exibição codificada por cores facilita a identificação da direção atual da tendência de relance.
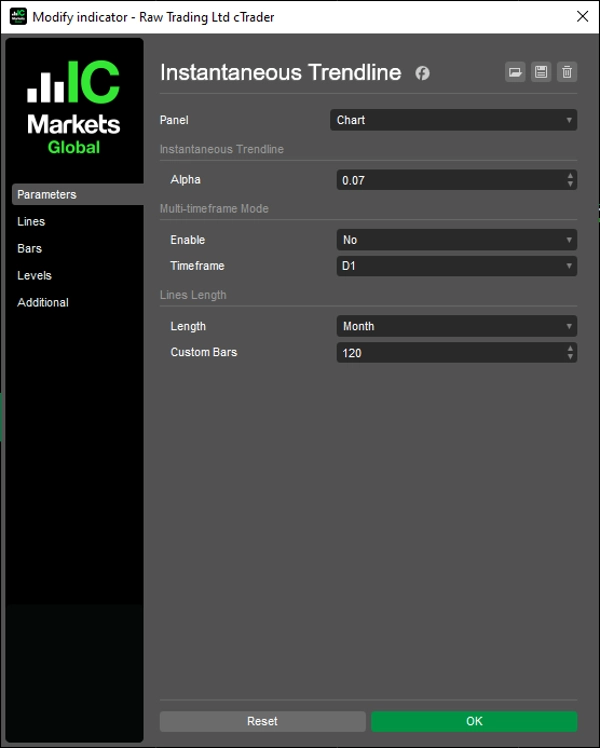
PARÂMETROS PRINCIPAIS
Alpha (0,01 - 1,0, padrão 0,07)
Controla a suavização e a responsividade da linha de tendência. Valores mais baixos produzem linhas de tendência mais suaves e com resposta mais lenta, adequadas para tendências de longo prazo. Valores mais altos aumentam a sensibilidade às mudanças de preço, mas podem gerar mais sinais falsos em mercados voláteis. O valor padrão de 0,07 equilibra a responsividade com a filtragem de ruído.
Comprimento das Linhas (padrão 120)
Determina quantas barras de dados históricos da linha de tendência são exibidas no gráfico. Isso ajuda a manter o gráfico limpo enquanto mantém contexto suficiente.
LIMITAÇÕES
- Como todas as ferramentas de seguimento de tendência, a Linha de Tendência Instantânea pode produzir sinais falsos (whipsaws) em mercados laterais e sem direção clara
- Durante tendências fortes, o indicador pode mantê-lo na tendência por mais tempo, mas você pode perder o topo ou fundo exato
- O desempenho varia significativamente dependendo das condições do mercado (tendência vs. lateral)
- O indicador é reativo, não preditivo - identifica tendências após elas terem começado
__________________________________________________________________________________________
MAIS INDICADORES GRATUITOS
Explore uma ampla gama de ferramentas de análise de mercado — desde estrutura e volume até regressão, volatilidade e períodos personalizados.
O código-fonte está disponível no repositório do GitHub repository.
Todos gratuitos para uso. Mas se quiser enviar um suporte para café, você pode fazer isso aqui.
Suporte/Resistência
Volume
- Volume Activity Profiler
- Volume Efficiency Analyzer
- Volume Profile Analytics
- Volume Profile - Updated
- Volume Spread Analysis
- VWAP (Preço Médio Ponderado por Volume)
Médias Móveis
- Canal SSL
- Média Móvel Ancorada
- Média Móvel Escalonada por Desvio
- Ativador Gann High Low
- Linha de Tendência Instantânea
- Média Móvel Adaptativa Kaufman com Visão de Tendência
- Canal de Média Móvel
- Conjunto de Médias Móveis
- Média Móvel do Canal de Tendência
Utilitários/Personalizados
Baseado em Regressão
Volatilidade
Osciladores
__________________________________________________________________________________________
AVISO LEGAL
Negociar envolve riscos. Este indicador é destinado apenas para análise técnica — sempre aplique uma gestão de risco adequada e negocie com responsabilidade.
FEEDBACK E MELHORIAS
Se você tiver sugestões, pedidos de recursos ou ideias para aprimoramento, por favor deixe um comentário na aba Discussão. Seu feedback ajuda a melhorar o indicador para todos.
Resumo
Avaliações de clientes
5 | 100 % | |
4 | 0 % | |
3 | 0 % | |
2 | 0 % | |
1 | 0 % |