
Daily TPO profile
Indicador
213 transferências
Versão 1.0, Nov 2025
Windows, Mac
Descrição
Perfil TPO Diário
Indicador de perfil TPO diário que calcula POC, VAH e VAL para cada sessão.
Plota o Ponto de Controle e a Área de Valor de 70% diretamente no gráfico, ajudando você a identificar zonas de valor justo, níveis chave de suporte/resistência e áreas potenciais de rejeição ou aceitação de preço.
Como funciona
Este indicador constrói um perfil TPO (Time Price Opportunity) diário, semelhante a um Perfil de Mercado.
Para cada barra do dia de negociação, ele:
- divide o eixo de preço em “passos” fixos definidos por “Tamanho da Linha (pips)”
- para cada passo de preço, conta quantas barras tocaram esse nível (TPO = quantas vezes o preço negociou ali)
- no final do dia calcula:
-
- POC (Ponto de Controle) → o nível de preço com o maior número de TPOs (onde o mercado passou mais tempo)
- VAH (Valor Alto da Área) e VAL (Valor Baixo da Área) → os níveis de preço que contêm aproximadamente % da Área de Valor (padrão 70%) de todos os TPOs para essa sessão
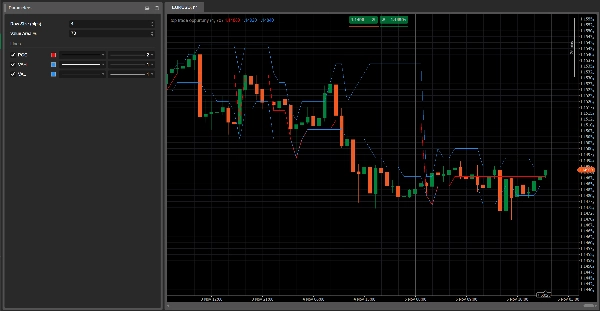
O indicador plota três linhas horizontais no gráfico:
- Linha vermelha → POC
- Linhas azuis → VAH (superior) e VAL (inferior)
Essas linhas são atualizadas barra a barra durante a sessão e reiniciadas quando um novo dia de negociação começa.
Parâmetros principais
Tamanho da Linha (pips)
Define a espessura de cada passo de preço no perfil.-
- Valores menores = perfil mais detalhado
- Valores maiores = perfil mais suave
% da Área de Valor
Percentual do total de TPOs contidos dentro da Área de Valor (tipicamente 70%).
A Área de Valor é a zona de preço onde ocorreu a maior parte da atividade do mercado durante o dia.
Como interpretar
- POC (linha vermelha)
-
- O nível de preço mais “aceito” pelo mercado durante aquele dia.
- Frequentemente atua como um nível de equilíbrio: o preço pode saltar, parar ou romper fortemente ao redor dessa zona.
- Área de Valor (VAH–VAL, linhas azuis)
-
- Representa a zona de “valor justo” onde a maior parte das negociações ocorreu.
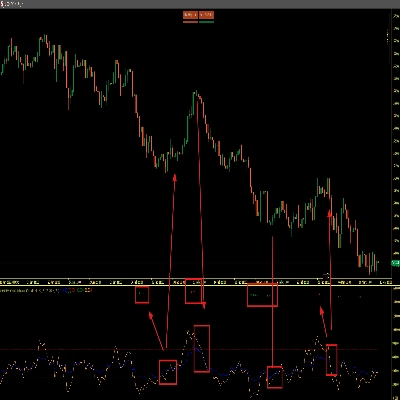
- A ação do preço em relação a VAH/VAL pode mostrar:
-
- Rejeição de preços extremos (falsos rompimentos além de VAH/VAL)
- Aceitação de novos preços (consolidação fora da Área de Valor)
Ideias típicas de uso
- O preço rejeita VAL e retorna para dentro da Área de Valor → ideia potencial de compra, apostando em um retorno ao “valor justo” (reversão à média).
- O preço rompe acima de VAH com força e começa a construir estrutura acima → início potencial de uma nova área de valor mais alta (cenário de seguimento de tendência).
- Vários dias com POCs em torno do mesmo nível → zona forte de equilíbrio/acumulação, frequentemente suporte/resistência chave.
Resumo
Resumo de IA
The Daily TPO Profile indicator constructs a daily Time Price Opportunity (TPO) profile similar to a Market Profile, analyzing market activity by price levels throughout each trading session. It divides the price axis into fixed increments ("Row Size" in pips) and counts how many bars traded at each price step, representing TPOs. At the end of the session, it calculates three key levels: the Point of Control (POC), where the market spent the most time; the Value Area High (VAH); and the Value Area Low (VAL), which together define the price range containing approximately 70% of the trading activity.
The indicator plots these levels as horizontal lines on the chart—POC in red, VAH and VAL in blue—updating them bar by bar during the session and resetting daily. Traders use the POC as an equilibrium price level that may act as support or resistance. The Value Area highlights fair value zones, with price action near VAH and VAL signaling potential rejection or acceptance of price extremes. Typical applications include identifying mean reversion opportunities when price rejects VAL or trend-following setups when price breaks above VAH.
Main adjustable parameters include Row Size (pips), controlling profile detail, and Value Area %, defining the percentage of TPOs included in the value area. The indicator supports analysis across various markets including forex, indices, commodities, stocks, and cryptocurrencies.
Perfil do indicador
Avaliações de clientes
0.0
Avaliações: 0
Avaliações de clientes
Ainda não há avaliações para este produto. Já o experimentou? Seja o primeiro a contar a outras pessoas!
Conversa
Perguntas frequentes
Signal
Indices
Commodities
GBPUSD
RSI
Bollinger
Fibonacci
Scalping
AI
XAUUSD
NAS100
MACD
BTCUSD
Forex
Breakout
EURUSD
NZDUSD
Martingale
Prop
ZigZag
Supertrend
Fair Value Gap
SMC
Crypto
Grid
Stocks
ATR
USDJPY
VWAP
Os produtos disponíveis através da cTrader Store, incluindo bots de negociação, indicadores e plugins, são fornecidos por programadores terceiros e são disponibilizados apenas para fins informativos e de acesso técnico. A cTrader Store não é um corretor e não fornece aconselhamento em matéria de investimento, recomendações pessoais ou qualquer garantia de desempenho no futuro.


Preço
42.11M
Volume negociado
6.13M
Pips ganhos
224
Vendas
8.41K
Instalações gratuitas