
Descrição
✅ O UATKit é fornecido gratuitamente como uma contribuição de boa vontade para a comunidade cTrader, criado por um trader profissional que entende os desafios diários da análise de gráficos e execução.
⚠️Por favor, verifique a página do produto periodicamente para atualizações, pois o cTrader não notifica os usuários quando novas versões dos indicadores são lançadas.
⭐️ Também ficarei feliz em receber seus comentários e feedback na Avaliações dos Clientes e nas Discussões.
1. O Que Este Produto É
Um conjunto abrangente de ferramentas para aprimorar o fluxo de trabalho, projetado para tornar a criação de gráficos no cTrader mais suave, clara e eficiente.
Universal Assistant Toolkit (UATKit) é um companheiro multifuncional para gráficos no cTrader.
Reúne várias ferramentas práticas - cada uma projetada para resolver uma necessidade específica do fluxo de trabalho - em um único indicador unificado e leve.
Cada recurso do UATKit é totalmente personalizável e funciona de forma independente, dando aos traders controle completo para ajustar comportamento, visuais e teclas de atalho, ativando apenas as ferramentas necessárias para uma experiência de gráficos limpa e responsiva.
O UATKit é fornecido gratuitamente como uma contribuição de boa vontade para a comunidade cTrader, criado por um trader profissional que entende os desafios diários da análise de gráficos e execução.
2. Para Quem Este Kit de Ferramentas É
O UATKit é feito para traders que:
- Passam muito tempo analisando gráficos
- Preferem layouts de gráficos limpos, informativos e personalizáveis
- Querem acesso mais rápido a ações comuns por meio de teclas de atalho
- Precisam de clareza visual durante mercados de alta velocidade
- Apreciam ferramentas que melhoram o fluxo de trabalho sem adicionar ruído
Seja você scalp trader, swing trader ou simplesmente deseja um ambiente de gráficos mais organizado, o UATKit se adapta ao seu estilo.
3. Visão Geral dos Grupos de Recursos
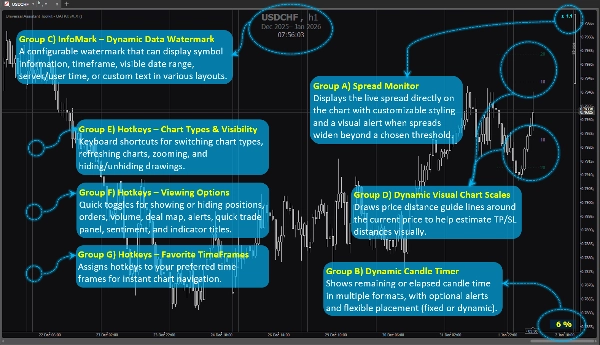
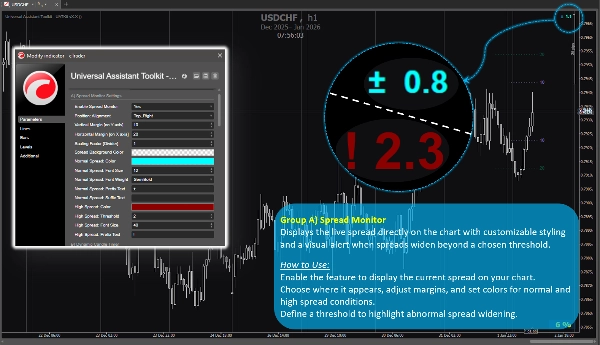
Grupo de Recursos A) 🔸 Monitor de Spread
Exibe o spread ao vivo diretamente no gráfico com estilo personalizável e um alerta visual quando os spreads aumentam além de um limite escolhido.
Como Usar:
Ative o recurso para exibir o spread atual no seu gráfico.
Escolha onde ele aparece, ajuste margens e defina cores para condições normais e de spread alto.
Defina um limite para destacar o aumento anormal do spread.
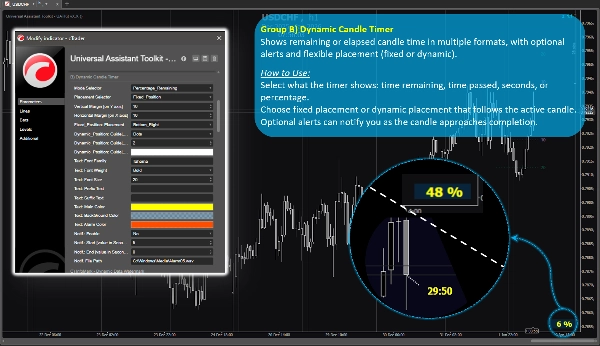
Grupo de Recursos B) 🔸 Temporizador Dinâmico de Velas
Mostra o tempo restante ou decorrido da vela em vários formatos, com alertas opcionais e posicionamento flexível (fixo ou dinâmico).
Como Usar:
Selecione o que o temporizador mostra: tempo restante, tempo passado, segundos ou porcentagem.
Escolha posicionamento fixo ou dinâmico que segue a vela ativa.
Alertas opcionais podem notificá-lo quando a vela estiver perto de completar.
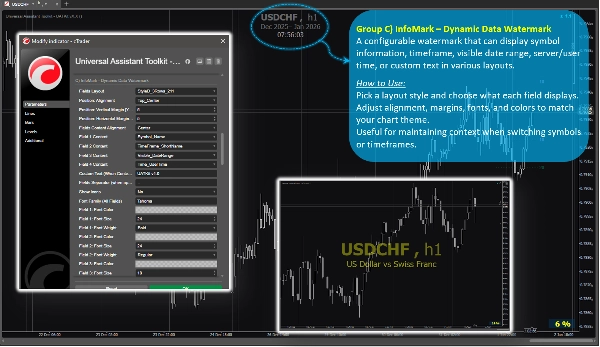
Grupo de Recursos C) 🔸 InfoMark – Marca d'água Dinâmica de Dados
Uma marca d'água configurável que pode exibir informações do símbolo, período de tempo, intervalo de datas visível, hora do servidor/usuário ou texto personalizado em vários layouts.
Como Usar:
Escolha um estilo de layout e selecione o que cada campo exibe.
Ajuste alinhamento, margens, fontes e cores para combinar com o tema do seu gráfico.
Útil para manter o contexto ao trocar símbolos ou períodos de tempo.
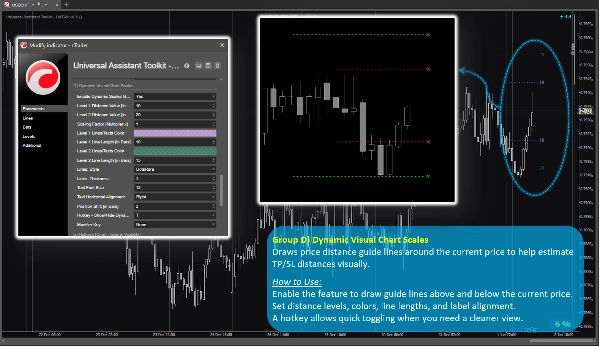
Grupo de Recursos D) 🔸 Escalas Visuais Dinâmicas do Gráfico
Desenha linhas guia de distância de preço ao redor do preço atual para ajudar a estimar visualmente as distâncias de TP/SL.
Como Usar:
Ative o recurso para desenhar linhas guia acima e abaixo do preço atual.
Defina níveis de distância, cores, comprimentos das linhas e alinhamento dos rótulos.
Uma tecla de atalho permite alternar rapidamente quando você precisar de uma visão mais limpa.
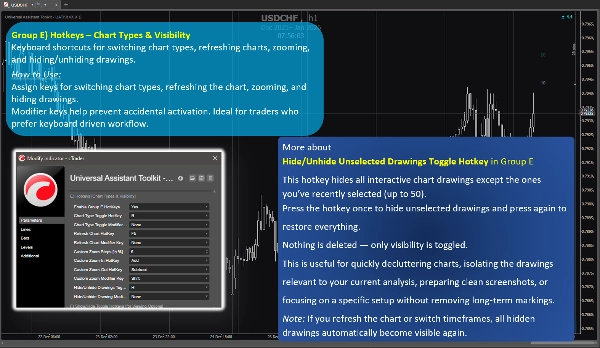
Grupo de Recursos E) 🔸 Teclas de Atalho – Tipos de Gráficos e Visibilidade
Atalhos de teclado para alternar tipos de gráficos, atualizar gráficos, zoom e ocultar/exibir desenhos.
Como Usar:
Atribua teclas para alternar tipos de gráficos, atualizar o gráfico, dar zoom e ocultar desenhos.
Teclas modificadoras ajudam a evitar ativações acidentais. Ideal para traders que preferem fluxo de trabalho baseado no teclado.
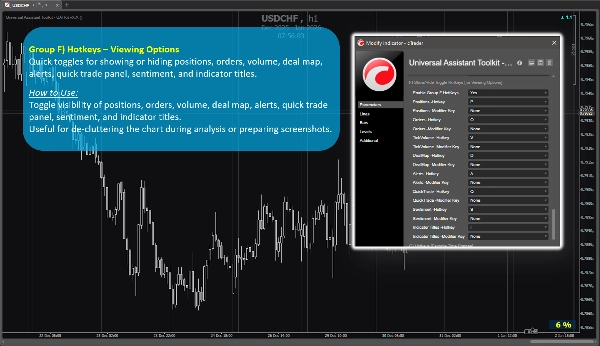
Grupo de Recursos F) 🔸 Teclas de Atalho – Opções de Visualização
Alternâncias rápidas para mostrar ou ocultar posições, ordens, volume, mapa de negócios, alertas, painel de negociação rápida, sentimento e títulos de indicadores.
Como Usar:
Alterne a visibilidade de posições, ordens, volume, mapa de negócios, alertas, painel de negociação rápida, sentimento e títulos de indicadores.
Útil para desobstruir o gráfico durante a análise ou preparar capturas de tela.
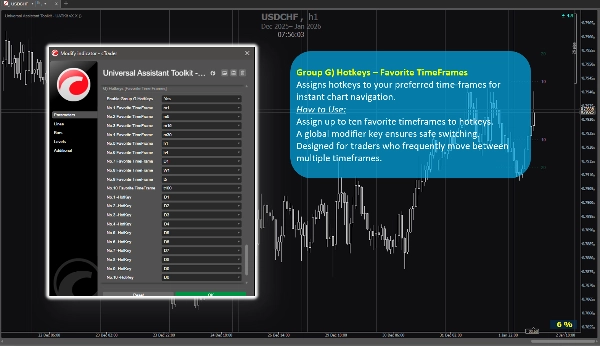
Grupo de Recursos G) 🔸 Teclas de Atalho – TimeFrames Favoritos
Atribui teclas de atalho para seus períodos de tempo preferidos para navegação instantânea no gráfico.
Como Usar:
Atribua até dez períodos de tempo favoritos às teclas de atalho.
Uma tecla modificadora global garante troca segura.
Projetado para traders que frequentemente alternam entre múltiplos períodos de tempo.
4. Notas Adicionais para Usuários
- Todos os recursos são opcionais e podem ser ativados ou desativados individualmente.
- O kit de ferramentas é otimizado para desempenho e projetado para não interferir com outros indicadores.
- A maioria dos parâmetros inclui dicas de ferramentas integradas. Basta passar o mouse sobre qualquer configuração para ver orientações extras e notas de uso.
- Nenhuma fonte de dados externa é usada; todas as informações vêm do gráfico e da plataforma.
- Este kit de ferramentas é fornecido gratuitamente para apoiar a comunidade cTrader e melhorar os fluxos de trabalho diários de gráficos.
- As configurações padrão são sensatas, para que usuários que não precisam de configurações especiais possam confiar nos parâmetros predefinidos sem gastar tempo extra na configuração.
- ⭐️ Feedback e sugestões são bem-vindos para ajudar a aprimorar versões futuras (use a seção de discussão nesta página).
- ⚠️Por favor, verifique a página do produto periodicamente para atualizações, pois o cTrader não notifica os usuários quando novas versões dos indicadores são lançadas.
Resumo
Key features include:
- **Spread Monitor:** Displays live spread on the chart with customizable visuals and alerts for spread widening.
- **Dynamic Candle Timer:** Shows remaining or elapsed candle time in various formats, with optional alerts and flexible positioning.
- **InfoMark Watermark:** Configurable watermark displaying symbol info, timeframe, date range, server/user time, or custom text.
- **Dynamic Visual Chart Scales:** Price-distance guide lines around current price to estimate take-profit/stop-loss distances visually.
- **Hotkeys for Chart Types & Visibility:** Keyboard shortcuts for switching chart types, refreshing, zooming, and toggling drawing visibility.
- **Hotkeys for Viewing Options:** Quick toggles for positions, orders, volume, deal map, alerts, quick trade panel, sentiment, and indicator titles.
- **Hotkeys for Favorite TimeFrames:** Assign up to ten favorite timeframes to hotkeys for instant navigation.
All features are optional and configurable, optimized for performance without interfering with other indicators. UATKit supports various markets including Forex, indices, commodities, crypto, and stocks. It is intended for traders who seek a clean, customizable, and efficient charting environment with enhanced workflow controls.
Avaliações de clientes
5 | 100 % | |
4 | 0 % | |
3 | 0 % | |
2 | 0 % | |
1 | 0 % |


![Logótipo de "[Hamster-Coder] Pivot Points (Demo)"](https://cdn.ctrader.com/image/webp/87b54299-8c73-4942-9207-4bc6db824811_31153)


