
Descripción
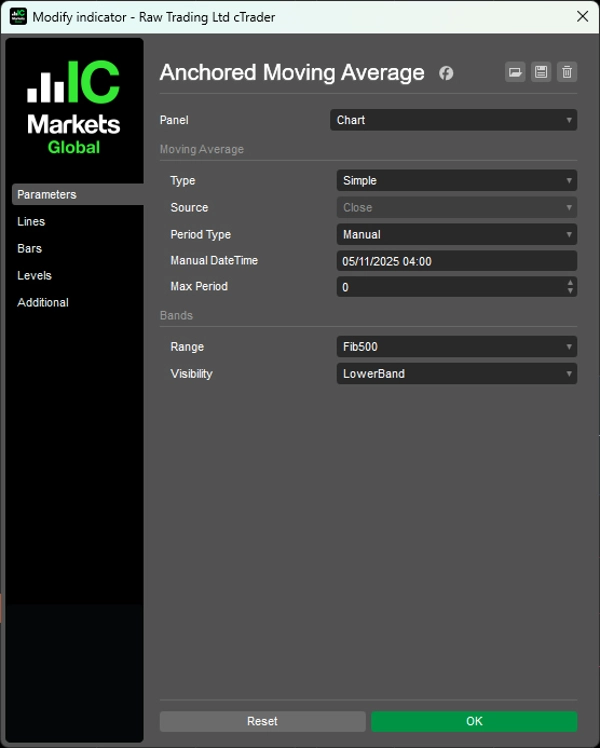
Bloquee el cálculo de la media móvil en cualquier momento del mercado y siga el comportamiento del precio a medida que se extiende hacia adelante.
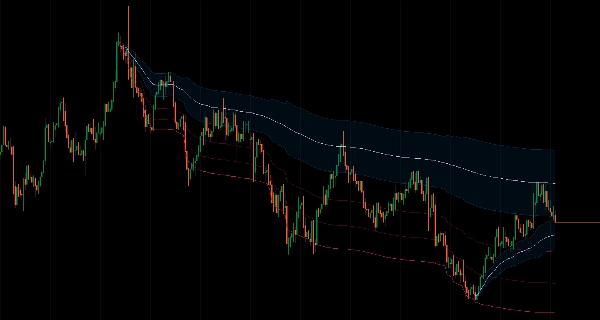
Fija el cálculo en su punto de inicio elegido (fecha y hora manual o período de retroceso desde 1 hora hasta 10 años), luego crece naturalmente con bandas de Fibonacci adaptativas basadas en el rango de precios real.
Ocho niveles de Fibonacci (11.4% a 100%) que se adaptan al movimiento real del precio, zona de reversión media incorporada del 38.2%-62.8%, dos tipos de MA (SMA/EMA), múltiples modos de visualización (bandas completas, solo límites extremos, solo zona de reversión) y limitador de período máximo para marcos temporales largos ofrecen seguimiento de momentum basado en eventos para traders que apuntan a retrocesos desde puntos de giro significativos y análisis del comportamiento del precio posterior al evento.
CARACTERÍSTICAS
Cálculo Anclado en el Tiempo
- A diferencia de las MAs estándar que usan períodos fijos, esta crece naturalmente desde su punto de inicio elegido
- Anclaje flexible: establezca fecha y hora manual o use períodos de retroceso predefinidos (1 hora a 10 años)
- Siga el momentum desde momentos significativos del mercado
- Puntos de anclaje consistentes en diferentes marcos temporales
Bandas de Fibonacci Adaptativas
- Bandas calculadas automáticamente basadas en el rango real de precios, no en múltiplos arbitrarios de ATR
- 8 niveles de Fibonacci (11.4% a 100%) que se adaptan al movimiento real del precio
- Zonas de reversión media: zona de reversión incorporada del 38.2%-62.8% para áreas de entrada de alta probabilidad
- Zonas de probabilidad definidas matemáticamente
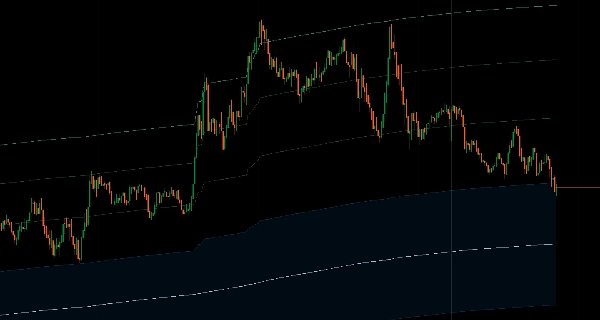
Dos Tipos de MA
- Media Móvil Simple
- Media Móvil Exponencial
- Limitador de período máximo: evita el exceso de suavizado en marcos temporales largos
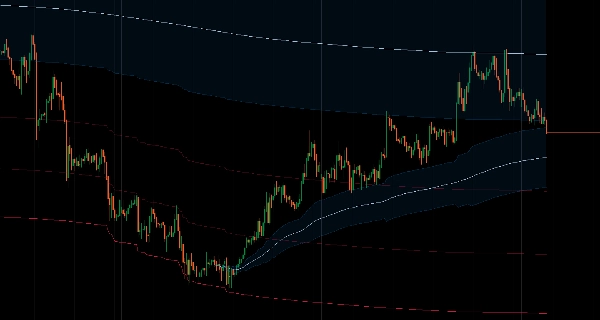
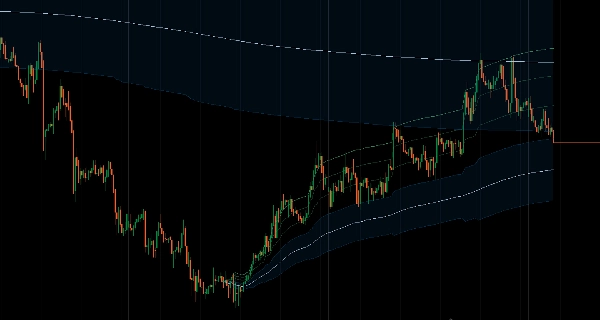
Múltiples Modos de Visualización
- Bandas completas: todos los niveles de Fibonacci visibles
- Solo superior/inferior: muestra los límites extremos
- Solo zona de reversión: enfoque en el área de reversión media
- Diseño limpio y con propósito sin desorden
Análisis Basado en Eventos
- Vea cómo el precio actual se relaciona con el movimiento desde niveles significativos
- Siga el comportamiento del precio posterior al evento
- Entradas basadas en estructura con puntos de referencia claros
__________________________________________________________________________________________
MÁS INDICADORES GRATUITOS
Explore una amplia gama de herramientas de análisis de mercado—desde estructura y volumen hasta regresión, volatilidad y marcos temporales personalizados.
El código fuente está disponible en el repositorio de GitHub repository.
Todos son gratuitos para usar. Pero si desea enviar apoyo para un café, puede hacerlo aquí.
Soporte/Resistencia
Volumen
- Perfilador de Actividad de Volumen
- Analizador de Eficiencia de Volumen
- Análisis de Perfil de Volumen
- Perfil de Volumen - Actualizado
- Análisis de Dispersión de Volumen
- VWAP (Precio Promedio Ponderado por Volumen)
Medias Móviles
- Canal SSL
- Media Móvil Anclada
- Media Móvil Escalada por Desviación
- Activador Gann High Low
- Línea de Tendencia Instantánea
- MA Adaptativa de Kaufman con Visión de Tendencia
- Canal de Media Móvil
- Suite de Medias Móviles
- Media Móvil de Canal de Tendencia
Utilidades/Personalizado
Basado en Regresión
Volatilidad
Osciladores
__________________________________________________________________________________________
DESCARGO DE RESPONSABILIDAD
El trading implica riesgos. Este indicador está destinado solo para análisis técnico — siempre aplique una gestión adecuada del riesgo y opere responsablemente.
COMENTARIOS Y MEJORAS
Si tiene sugerencias, solicitudes de funciones o ideas para mejoras, por favor deje un comentario en la pestaña de Discusión. Sus comentarios ayudan a mejorar el indicador para todos.
Resumen
The indicator features adaptive Fibonacci bands calculated based on the actual price range, not arbitrary multiples. It includes eight Fibonacci levels from 11.4% to 100%, with a built-in mean reversion zone between 38.2% and 62.8%, providing mathematically defined probability zones for potential entry areas. Multiple display modes are available, including full bands, extreme boundaries only, or reversion zone only, designed for a clean and purposeful chart presentation.
This tool facilitates analysis of price behavior relative to significant swing points or events, supporting structured entries and post-event price tracking. It is intended for technical analysis and includes a disclaimer advising responsible trading with proper risk management.
Valoraciones de clientes
5 | 100 % | |
4 | 0 % | |
3 | 0 % | |
2 | 0 % | |
1 | 0 % |


