说明
跨任何周期的开盘区间结构——从盘中交易时段到年度周期——结合斐波那契水平和扩展投影。
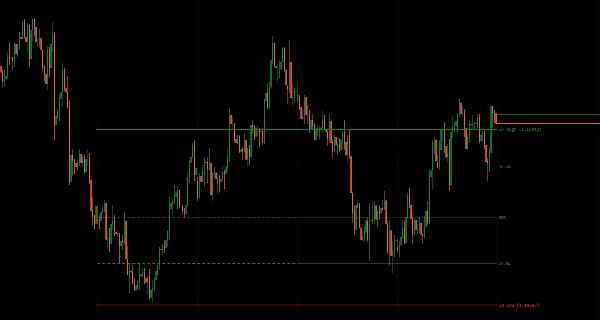
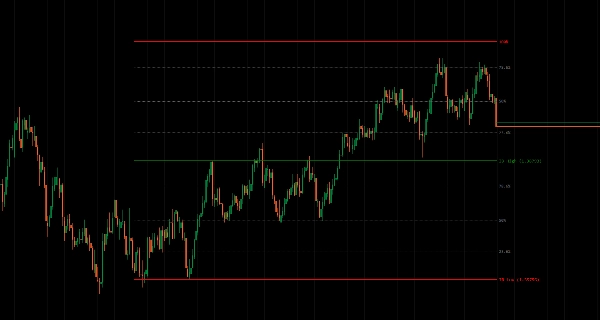
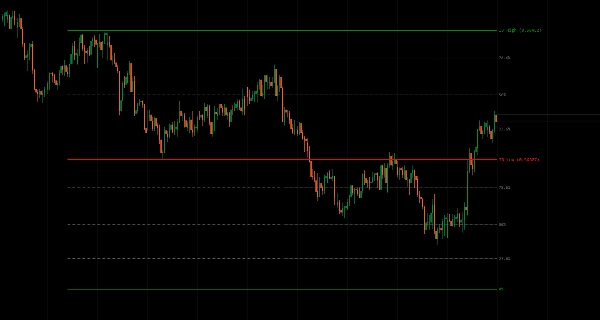
标记开盘期间(每日、每周、每月、每季度、每年或自定义区间)内建立的高/低区间,作为突破、均值回归和波动性预期的参考。
八种周期类型,具备时区感知的交易时段检测(悉尼/东京/伦敦/纽约)、多周期比较的历史偏移、可选七个斐波那契水平(11.4%至88.6%)位于IB区间内、从边界向上/向下的投影、灵活的线条延伸控制(仅IB周期、当前K线或向前N周期),以及精确的周期检测,为交易者提供全面的开盘区间分析,助力基于结构的多时间框架交易策略。
功能特点
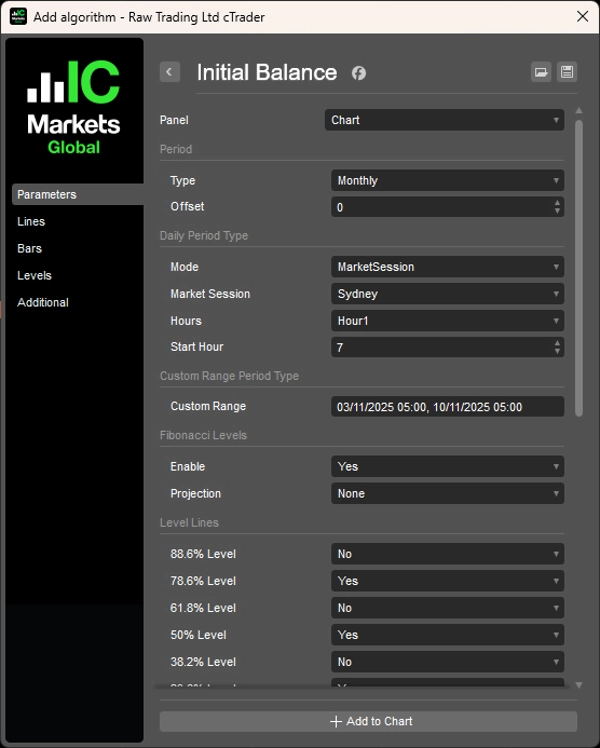
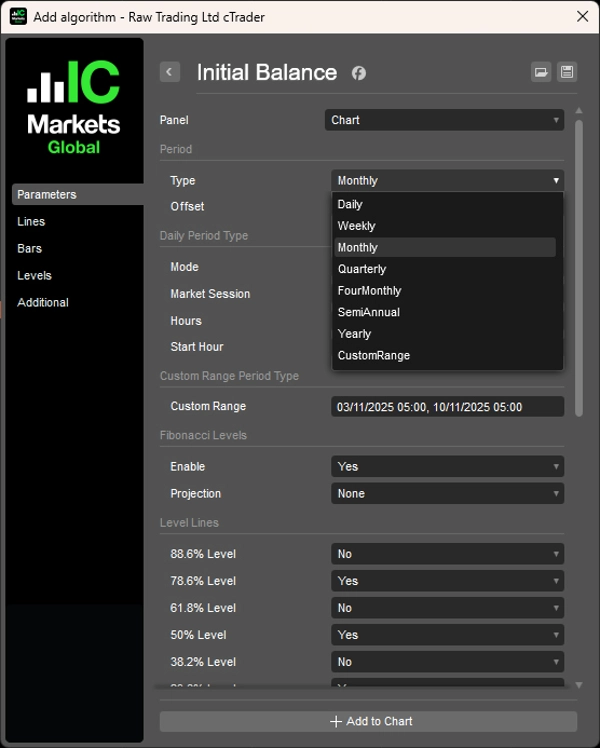
8种周期类型
- 每日、每周、每月、每季度、4个月、半年、每年、自定义区间
- 每日模式:基于小时(1-12小时)或市场交易时段(悉尼/东京/伦敦/纽约)
- 可配置的交易时段开始时间,具备时区感知的UTC偏移调整
- 自定义区间:定义事件驱动分析的精确开始/结束日期时间
历史周期
- 偏移参数以查看过去的IB区间(例如,上周IB,上月IB)
- 将当前价格行为与前期结构进行比较
- 多周期分析以确认趋势
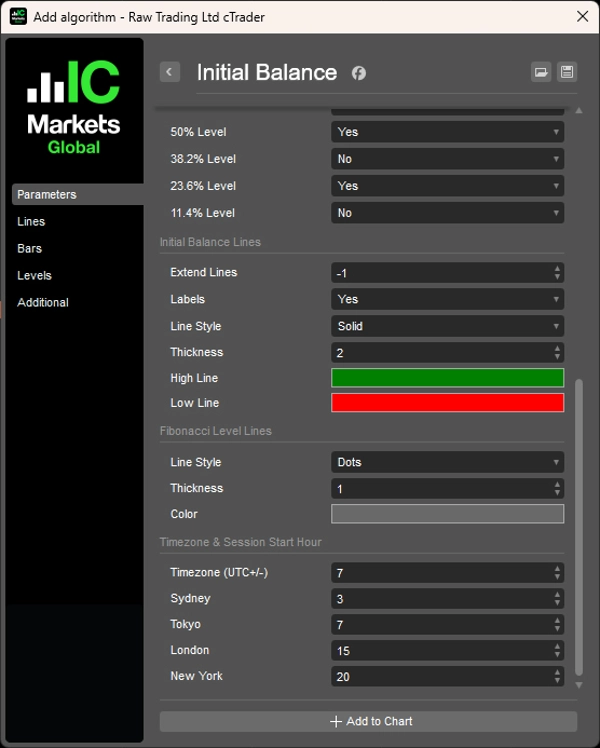
斐波那契水平
- 可选7个水平(11.4%、23.6%、38.2%、50%、61.8%、78.6%、88.6%)位于IB区间内
- 均值回归区间内的平衡区域
- 精确的进出场参考点
斐波那契投影
- 从IB高点/低点向上/向下投影水平
- 区间之外的潜在突破目标
- 方向性移动的扩展区域
线条延伸控制
- 仅IB周期:显示形成周期内的区间
- 当前K线:延伸至当前
- 向前N周期:投影至未来以便规划
- 清晰的视觉管理
精确周期检测
- 针对每种周期类型的准确开盘区间计算
- 具备全球市场的时区感知
- 干净处理交易时段重叠和转换
__________________________________________________________________________________________
更多免费指标
探索广泛的市场分析工具——从结构和成交量到回归、波动率和自定义时间框架。
源代码可在GitHub 仓库中获取。
全部免费使用。但如果您愿意支持一杯咖啡,可以通过 这里进行捐赠。
支撑/阻力
成交量
移动平均线
实用工具/自定义
基于回归
波动率
振荡器
__________________________________________________________________________________________
免责声明
交易存在风险。此指标仅用于技术分析——请始终应用适当的风险管理并负责任地交易。
反馈与改进
如果您有建议、功能请求或改进想法,请在讨论标签页留言。您的反馈有助于提升此指标,造福所有用户。
摘要
Key features include configurable session start times with UTC offset adjustments, historical offset parameters for comparing past initial balance ranges, and multi-period analysis for trend confirmation. It offers optional Fibonacci retracement levels (11.4% to 88.6%) within the initial balance range to highlight mean reversion zones and precise entry or exit points. Additionally, Fibonacci projections extend upward or downward from the initial balance boundaries to indicate potential breakout targets and directional extension zones.
Line extension controls allow users to display the range during its formation, extend it to the current bar, or project it forward for planning purposes. The indicator ensures precise period detection, handling session overlaps and transitions accurately for global market analysis. This tool aids traders in identifying breakout, mean reversion, and volatility expectations based on opening range structures across all timeframes.
客户评价
5 | 50 % | |
4 | 50 % | |
3 | 0 % | |
2 | 0 % | |
1 | 0 % |


!["[Stellar Strategies] Smart ADX" 标识](https://cdn.ctrader.com/image/webp/af13b084-b6f6-41db-b7bc-c7e688b57b05_36929)