说明
使用所有四个OHLC价格的移动平均线的三色自适应通道系统,用于趋势方向和结构分析。
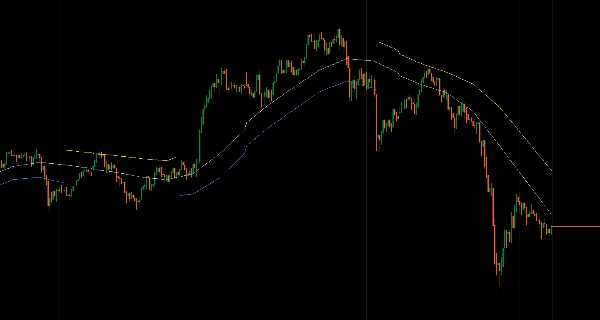
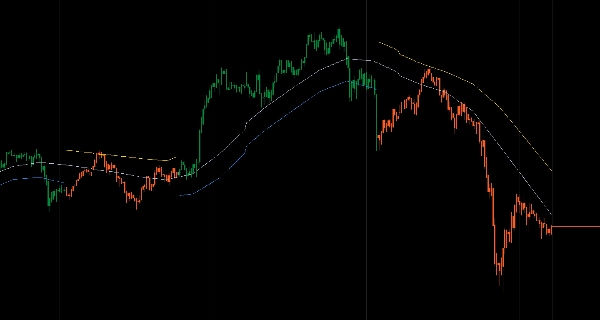
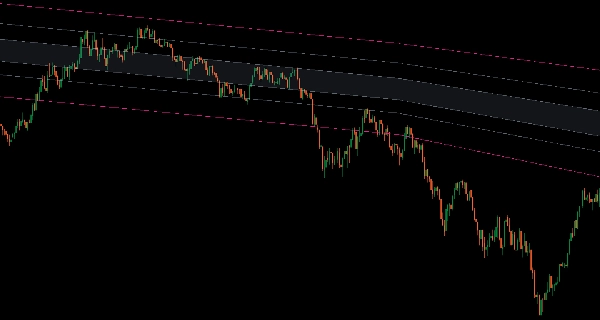
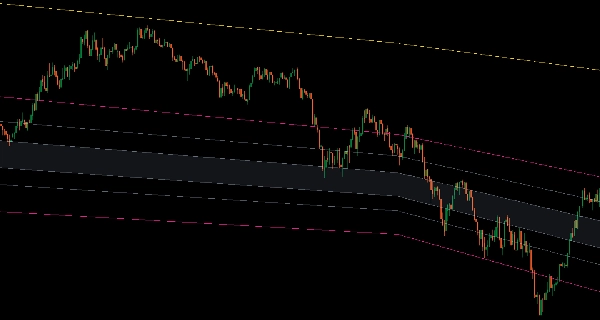
显示高/低边界、开盘/收盘方向偏向线和中位平衡线,配以颜色编码的趋势状态(蓝色上涨趋势,金色下跌趋势,灰色中性),共同自适应。
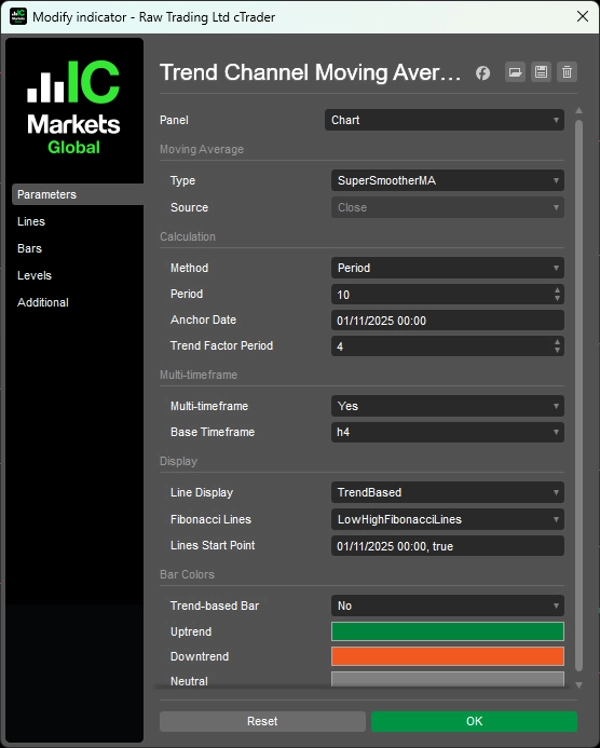
两种显示模式(完整通道或基于趋势的杂乱减少),六个可选斐波那契区域(完整通道回撤、半通道水平、突破扩展),15种移动平均算法(Arnaud Legoux、Jurik、Hull、KAMA、VIDYA、偏差缩放、SuperSmoother、Ultimate Smoother、McGinley Dynamic、T3、ZLEMA、Laguerre),多时间框架插值,基于事件的锚定日期计算增长周期,以及基于趋势的柱状着色,为交易者提供在定义边界内针对回调和均值回归的连贯通道结构。
功能特点
三色趋势系统
- 蓝线:确认上涨趋势——交易回调至低线
- 金线:确认下跌趋势——交易反弹至高线
- 灰线:中性/盘整——淡化极端,剥头皮中间
- 所有线条共同自适应——无混合信号
完整通道结构
- 高/低线定义通道边界
- 开盘/收盘线显示通道内的方向偏向
- 中位线(四者中心)标记真实平衡点
- 集成结构协同移动
两种显示模式
- 通道模式:始终显示两个边界及趋势颜色
- 基于趋势模式:上涨趋势隐藏高线,下跌趋势隐藏低线——减少视觉杂乱,聚焦可交易边界
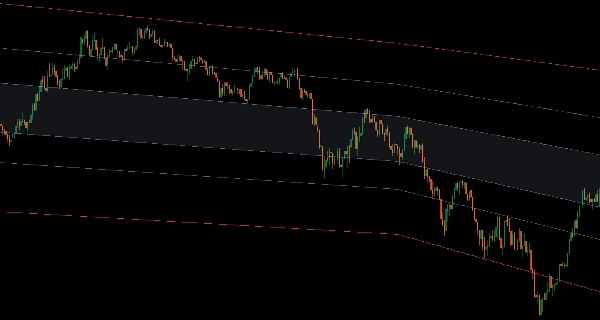
6个斐波那契区域(可选)
- 低-高之间(完整通道回撤)
- 低-中位或中位-高之间(半通道水平)
- 上/下扩展(突破目标)
- 总范围(从下扩展到上扩展)
15种移动平均类型
- 专业算法:Arnaud Legoux、Jurik、Hull、KAMA、VIDYA、偏差缩放、SuperSmoother、Ultimate Smoother、McGinley Dynamic、T3、ZLEMA、Laguerre
- 为趋势识别优化的清晰信号
高级功能
- 多时间框架模式,平滑插值
- 锚定日期计算(基于特定事件/水平的增长周期)
- 基于趋势的柱状着色(可选)
- 线条起点控制(隐藏历史数据,仅显示最近结构)
__________________________________________________________________________________________
更多免费指标
探索广泛的市场分析工具——从结构和成交量到回归、波动率和自定义时间框架。
源代码可在GitHub 仓库获取。
全部免费使用。但如果您愿意支持咖啡费用,可以通过 这里捐助。
支撑/阻力
成交量
移动平均线
实用工具/自定义
基于回归
波动率
振荡器
__________________________________________________________________________________________
免责声明
交易存在风险。此指标仅用于技术分析——请始终应用适当的风险管理并负责任地交易。
反馈与改进
如果您有建议、功能请求或改进想法,请在讨论标签页留言。您的反馈有助于为所有人改进该指标。
摘要
Key features include two display modes—full channel and trend-based clutter reduction—and six optional Fibonacci zones covering full and half-channel retracements plus breakout extensions. The system supports 15 professional moving average algorithms such as Arnaud Legoux, Jurik, Hull, KAMA, VIDYA, and others, optimized for clean trend identification. Additional functionalities include multi-timeframe interpolation, anchor date calculation for event-based periods, trend-based bar coloring, and control over line start points to focus on recent data.
This indicator is designed to help traders identify pullbacks and mean reversion opportunities within defined channel boundaries, enhancing decision-making in various market conditions.
客户评价
5 | 100 % | |
4 | 0 % | |
3 | 0 % | |
2 | 0 % | |
1 | 0 % |