说明
概述
基础:Wyckoff 原则
该指标基于Wyckoff方法论中的两个互补概念构建:
1. 努力与结果
Wyckoff的核心原则指出,价格变动(结果)应与其背后的成交量(努力)成比例。当努力与结果协调时,市场表现正常。当两者背离时,预示潜在的转折点或持续力量。
该指标通过效率指标(单位努力的结果)及其反向指标吸收(努力未转化为结果)直接实现了这一点。
2. 价差分析
Wyckoff还强调分析单个价格柱的特征——检查价差(区间)、价格在该区间内的收盘位置,以及该柱是否显示出承诺或犹豫。
该指标通过信念(方向性承诺)、浪费比率(柱内回撤)和收盘位置(用于将吸收情境化为积累或分配)实现价差分析。
该指标的功能
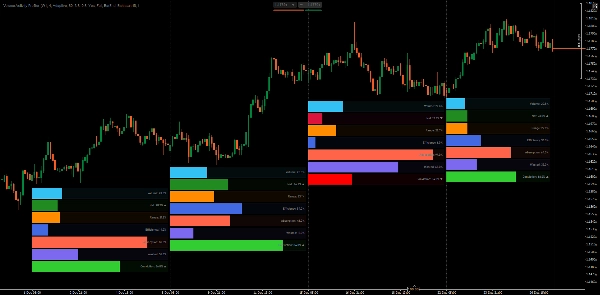
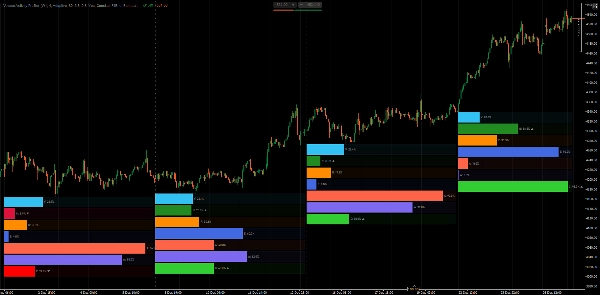
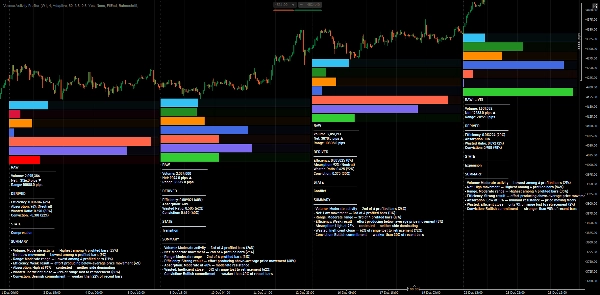
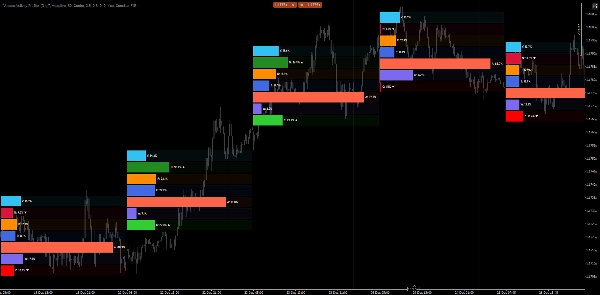
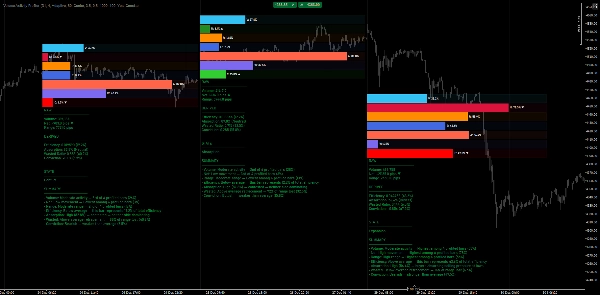
成交量活动分析器分析选定时间框架内的价格柱,并将其活动分解为可测量的组成部分。它计算原始指标和基于百分位的派生指标,然后以水平条形图形式显示,锚定在每个分析柱下方。
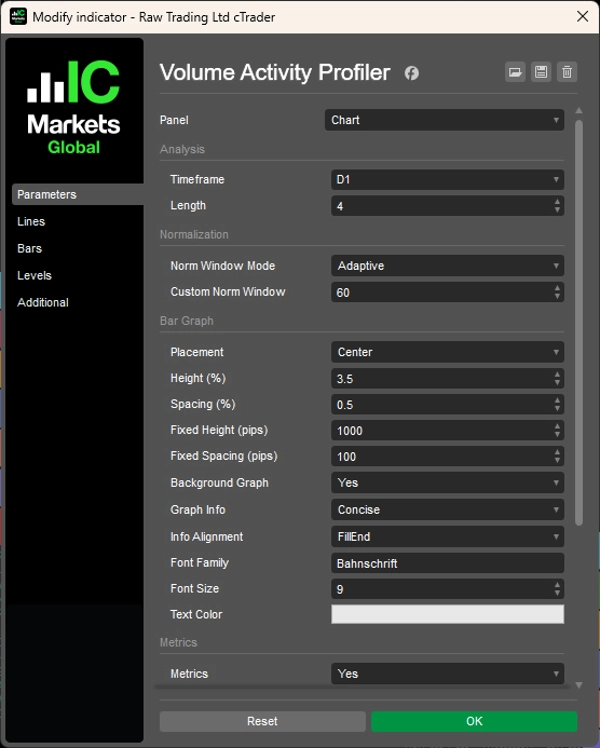
您可以配置两个主要参数:
- 时间框架:要分析的时间框架(例如,周线,日线,H4)
- 长度:要分析的柱数(例如,最近4根柱)
然后,指标在该范围内对每根柱进行分析,计算指标并将其相互及与历史标准进行排名比较。
指标说明
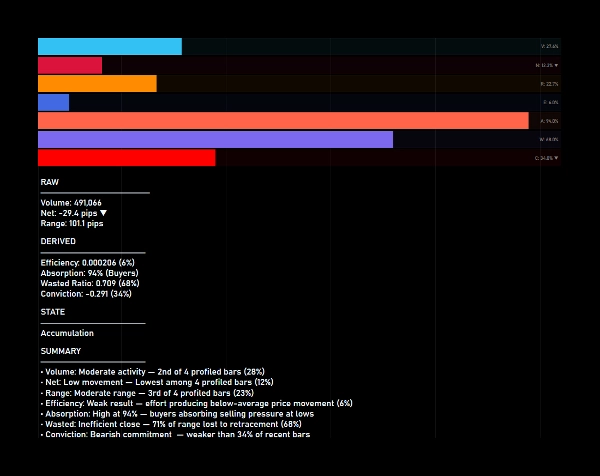
原始指标(在分析柱中基于比例):
1. 成交量
柱的成交量。显示该柱占分析总成交量的比例。
2. 净值
方向性移动(收盘价 − 开盘价)以点数计。显示总净移动的比例。颜色表示方向(绿色=看涨,红色=看跌)。
3. 区间
总价格区间(最高价 − 最低价)以点数计。显示分析柱中总区间的比例。
派生指标(基于历史窗口的百分位):
1. 效率(努力与结果)
每单位成交量产生的区间。高效率意味着努力转化为价格变动。低效率暗示吸收或阻力。
2. 吸收(努力与结果)
效率的反向指标。高吸收表示成交量被吸收但价格未按比例变动——可能是积累或分配。
3. 浪费(价差分析)
因回撤损失的区间百分比(区间 − 净值)/ 区间。高浪费意味着该柱回吐了大部分移动。低浪费表示清晰的方向性柱。
4. 信念(价差分析)
以净值/区间衡量的方向性承诺。高信念意味着该柱收盘接近极端。低信念表示犹豫或拒绝。
理解条形图
每根分析柱显示7个水平条:
- 成交量,净值,区间 — 根据分析柱中的比例填充
- 效率,吸收,浪费,信念 — 根据相对于历史数据的百分位排名填充
效率条填充至80%意味着该柱的效率高于归一化窗口中80%的柱。
活动状态分类
启用指标显示时,指标将每根柱分类为以下状态之一:
1. 压缩
低效率 + 低信念 — 价格盘整,潜在能量积聚
2. 扩张
高效率 + 高信念 + 低浪费 — 强烈的方向性移动
3. 冲突
高浪费 + 低信念 — 买卖双方的争斗
4. 积累
高吸收 + 收盘接近低点 — 买方吸收卖压
5. 分配
高吸收 + 收盘接近高点 — 卖方吸收买压
6. 拒绝
高信念但收盘方向相反 — 失败的移动,潜在反转
7. 过渡
信号混合 — 市场处于状态过渡中
实际益处
- 快速努力与结果评估 — 立即查看成交量是否产生了成比例的移动或被吸收。
- 多时间框架结构分析 — 在执行时间框架内分析更高时间框架的柱。
- 识别积累/分配 — 高吸收与收盘位置揭示大型参与者可能活跃的区域。
- 发现疲劳和拒绝 — 高信念与相反收盘位置警示潜在反转。
- 客观比较柱 — 排名和百分位消除“高”或“低”成交量评估的主观性。
- 确认突破 — 高效率和信念的扩张状态确认真实的突破兴趣。
以Tick成交量作为努力代理
该指标使用tick成交量作为努力输入。在外汇市场中,tick成交量代表价格变动频率,而非实际交易量——这是去中心化市场的已知限制。
尽管如此,tick成交量有效地作为努力代理,因为:
- 它反映了柱间的相对市场活动
- 高tick计数表示参与者活跃度增加
- 努力与结果的关系成立——高活动但移动小仍表示吸收
只要数据一致,指标的百分位排名和柱比较保持有效。
注意事项
- 当设置为自适应模式时,指标使用基于时间框架的自适应归一化窗口,确保相关的历史背景。
- 百分位计算仅在完成的柱上更新,以避免形成中柱的不稳定读数。
- 当前形成的柱在指标面板中标记为 [LIVE]。
__________________________________________________________________________________________
更多免费指标
探索广泛的市场分析工具——从结构和成交量到回归、波动率和自定义时间框架。
源代码可在GitHub 仓库获取。
全部免费使用。但如果您想支持咖啡,可以通过 这里捐助。
支撑/阻力
成交量
移动平均线
实用工具/自定义
基于回归
波动率
振荡器
__________________________________________________________________________________________
免责声明
交易存在风险。该指标仅用于技术分析——请始终应用适当的风险管理并负责任地交易。
反馈与改进
如果您有建议、功能请求或改进想法,请在讨论标签页留言。您的反馈有助于为所有人改进该指标。
摘要
The indicator profiles price bars over a user-selected timeframe and length, calculating raw metrics such as Volume (tick volume proportion), Net (directional price movement), and Range (price range). It also derives percentile-based metrics including Efficiency (price movement per volume unit), Absorption (volume without proportional price change), Wasted Ratio (retracement within the bar), and Conviction (directional commitment).
These metrics are visually represented as horizontal bar graphs beneath each analyzed bar, facilitating objective comparison and historical context. The indicator classifies bars into activity states like Compression, Expansion, Conflict, Accumulation, Distribution, Rejection, and Transition, aiding in identifying market phases and potential turning points.
Volume Activity Profiler uses tick volume as an effort proxy, reflecting relative market activity. It supports multi-timeframe analysis and updates percentile rankings on completed bars to ensure stable readings. This tool assists traders in assessing volume efficiency, spotting accumulation/distribution, confirming breakouts, and understanding market structure through quantitative volume and price bar analysis.
客户评价
5 | 100 % | |
4 | 0 % | |
3 | 0 % | |
2 | 0 % | |
1 | 0 % |