
Description
APERÇU
L'analyse du volume et de la fourchette (VSA) est une méthodologie développée par Tom Williams, un ancien trader de syndicat, basée sur les travaux de Richard Wyckoff du début des années 1900. La VSA interprète la relation entre le volume, la fourchette de prix (plage) et la position de clôture pour identifier les déséquilibres entre l'offre et la demande.
Concepts clés de la VSA :
- Volume montre la quantité d'activité - qui participe
- Fourchette montre la volatilité et l'incertitude - jusqu'où le prix a bougé
- Position de clôture montre qui a gagné la barre - acheteurs ou vendeurs
- Contexte montre où nous en sommes dans le cycle du marché - phase de force ou de faiblesse
Lorsque le volume augmente avec une large fourchette mais peu de progression du prix, cela suggère une absorption (un côté absorbant la pression de l'autre). Lorsque le volume diminue avec une fourchette étroite dans une tendance, cela suggère un manque de participation (faiblesse potentielle).
Cette implémentation :
Cet indicateur quantifie les concepts de la VSA en utilisant des méthodes statistiques. Il diffère de la VSA traditionnelle de plusieurs façons :
- Utilise
(close - open) / rangecomme métrique d'efficacité (pas dans la VSA originale) - Les modèles d'absorption identifient "un côté gagnant" plutôt que la traditionnelle "absorption de pression"
- ENR (Effort Sans Résultat) est quantifié en utilisant un seuil d'efficacité ; la VSA originale est plus interprétative
- Utilise la moyenne tronquée pour la moyenne du volume (résistante aux valeurs aberrantes) et le classement en percentile pour la fourchette
- N'inclut pas : Volume d'arrêt, Upthrust, Test, modèles de Shakeout
C'est une approche quantifiée et algorithmique des concepts de la VSA. La VSA traditionnelle est plus interprétative et dépendante du contexte. Utilisez cet indicateur comme un outil analytique parmi d'autres, pas comme des signaux autonomes.
CE QUE FAIT CET INDICATEUR
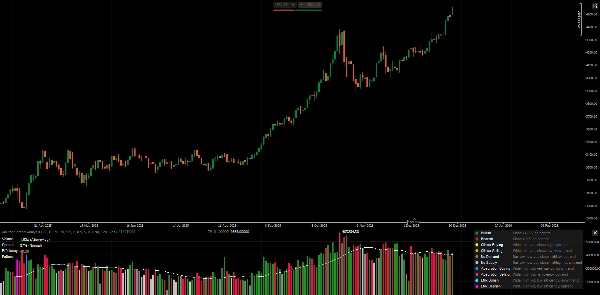
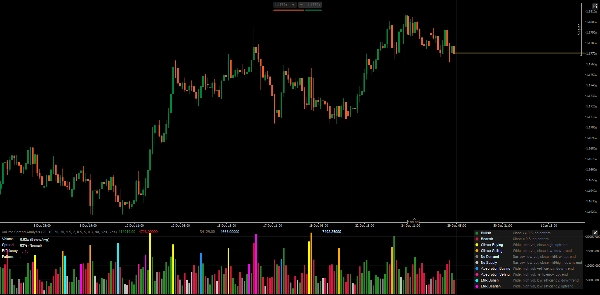
Analyse le volume, la fourchette et la position de clôture de chaque barre pour détecter d'éventuels déséquilibres entre l'offre et la demande. Affiche un histogramme de volume coloré selon le type de modèle, avec un panneau de métriques en temps réel.
DÉFINITIONS DES MODÈLES
1. Barres standard (Pas de modèle)
- Haussier : Clôture ≥ 0,5 dans la fourchette, aucun modèle spécial détecté
- Baissier : Clôture < 0,5 dans la fourchette, aucun modèle spécial détecté
2. Modèles de climax (Épuisement potentiel)
- Climax d'achat : Large fourchette + volume ultra élevé + clôture haute + en tendance haussière
-
- Interprétation : Épuisement possible des acheteurs, surveiller un retournement
- Climax de vente : Large fourchette + volume ultra élevé + clôture basse + en tendance baissière
-
- Interprétation : Épuisement possible des vendeurs, surveiller un retournement
3. Modèles faibles (Manque de conviction)
- Pas de demande : Fourchette étroite + faible volume + clôture milieu/bas + en tendance haussière
-
- Interprétation : Les acheteurs ne soutiennent pas le rallye, faiblesse potentielle
- Pas d'offre : Fourchette étroite + faible volume + clôture milieu/haut + en tendance baissière
-
- Interprétation : Les vendeurs ne poussent pas à la baisse, force potentielle
4. Modèles d'absorption (Un côté gagne)
- Absorption d'achat : Large fourchette + volume élevé + efficacité positive + en tendance baissière
-
- Interprétation : Les acheteurs absorbent la pression de vente, retournement potentiel à la hausse
- Absorption de vente : Large fourchette + volume élevé + efficacité négative + en tendance haussière
-
- Interprétation : Les vendeurs absorbent la pression d'achat, retournement potentiel à la baisse
5. Modèles ENR (Effort sans résultat clair)
- ENR haussier : Large fourchette + volume élevé + faible efficacité + en tendance baissière
-
- Interprétation : Effort élevé mais pas de gagnant clair, support/indécision potentiels
- ENR baissier : Large fourchette + volume élevé + faible efficacité + en tendance haussière
-
- Interprétation : Effort élevé mais pas de gagnant clair, résistance/indécision potentiels
EXPLICATION DU PANNEAU DE MÉTRIQUES
Volume
- Montre le volume de la barre actuelle en ratio par rapport à la moyenne tronquée (ex : "1,85x")
- Classification : Faible / En dessous de la moyenne / Au-dessus de la moyenne / Élevé / Ultra élevé
- Volume élevé = participation au marché, mais le contexte est important
Fourchette
- Montre le rang percentile (0-100%) par rapport aux barres récentes
- Classification : Étroit / Normal / Large
- Large fourchette = volatilité/incertitude, pas nécessairement direction
Efficacité
- Formule :
(close - open) / (high - low) - Plage : -1,0 à +1,0
- Positif = corps haussier domine la fourchette
- Négatif = corps baissier domine la fourchette
- Près de zéro = petit corps, grande mèche, indécision
Modèle
- Modèle détecté actuel (ou "-" si aucun)
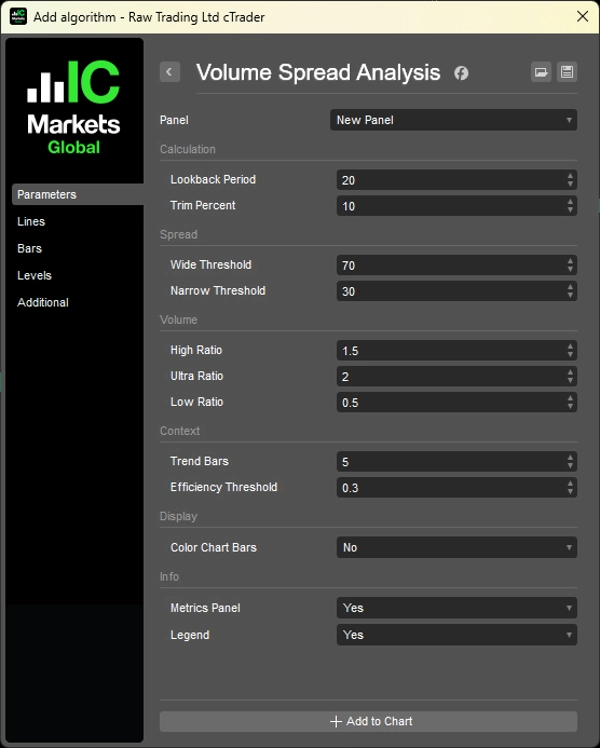
PARAMÈTRES
1. Calcul
- Période de retour (20) : Barres utilisées pour les statistiques de volume/fourchette
- Pourcentage de coupe (10 %) : Supprime les valeurs aberrantes du calcul du volume
2. Classification de la fourchette
- Seuil large (70 %) : Percentile pour classer comme "large"
- Seuil étroit (30 %) : Percentile pour classer comme "étroit"
3. Classification du volume
- Ratio élevé (1,5x) : Seuil au-dessus de la moyenne
- Ratio ultra (2,0x) : Seuil ultra élevé
- Ratio faible (0,5x) : Seuil en dessous de la moyenne
4. Contexte
- Barres de tendance (5) : Barres en arrière pour comparer la direction de la tendance
- Seuil d'efficacité (0,3) : Minimum pour une efficacité "forte"
5. Affichage
- Colorer les barres du graphique : Appliquer les couleurs des modèles au graphique des prix
- Panneau de métriques : Afficher les métriques en temps réel
- Légende : Afficher le guide de référence des modèles
COMMENT UTILISER
1. Ne pas utiliser les modèles comme signaux de trading directs - ils indiquent un contexte potentiel, pas des entrées.
2. Combiner avec la structure des prix - la VSA fonctionne mieux en confirmant ce que montre la structure des prix.
3. Surveiller le contexte - un même modèle peut signifier différentes choses au support ou à la résistance.
4. La perspective du volume est importante - absorption de volume élevée à un niveau clé > absorption aléatoire d'une barre.
Limitation du volume Forex
Le marché au comptant Forex affiche le volume tick (nombre de changements de prix), pas les contrats réellement échangés. Les modèles peuvent être moins fiables que dans les futures/actions avec de vraies données de volume.
LÉGENDE (Référence intégrée)
Activez le paramètre "Légende" pour afficher les descriptions des modèles directement sur le graphique.
__________________________________________________________________________________________
PLUS D'INDICATEURS GRATUITS
Explorez une large gamme d'outils d'analyse de marché — de la structure et du volume à la régression, la volatilité et les périodes personnalisées.
Le code source est disponible sur le dépôt GitHub.
Tous gratuits à utiliser. Mais si vous souhaitez offrir un café en soutien, vous pouvez le faire ici.
Support/Résistance
Volume
- Profileur d'activité de volume
- Analyseur d'efficacité du volume
- Analyse du profil de volume
- Profil de volume - Mis à jour
- Analyse du volume et de la fourchette
- VWAP (Prix moyen pondéré par le volume)
Moyennes mobiles
- Canal SSL
- Moyenne mobile ancrée
- Moyenne mobile à échelle de déviation
- Activateur Gann High Low
- Ligne de tendance instantanée
- Moyenne mobile adaptative Kaufman avec Trend Vision
- Canal de moyenne mobile
- Suite de moyennes mobiles
- Moyenne mobile du canal de tendance
Utilitaires/Personnalisé
Basé sur la régression
Volatilité
Oscillateurs
__________________________________________________________________________________________
AVERTISSEMENT
Le trading comporte des risques. Cet indicateur est destiné uniquement à l'analyse technique — appliquez toujours une gestion des risques appropriée et tradez de manière responsable.
RETROACTION & AMÉLIORATIONS
Si vous avez des suggestions, des demandes de fonctionnalités ou des idées d'amélioration, veuillez laisser un commentaire dans l'onglet Discussion. Vos retours aident à améliorer l'indicateur pour tous.
Résumé
This implementation quantifies VSA concepts using statistical methods, including an efficiency metric defined as (close - open) / range, trimmed mean volume averaging, and percentile ranking for spread. It identifies several bar patterns: Standard (bullish/bearish), Climax (buying/selling exhaustion), Weak (No Demand/No Supply), Absorption (one side winning), and ENR (Effort No Result), each indicating different market conditions.
The indicator displays a volume histogram colored by detected pattern type and provides a real-time metrics panel showing volume ratio, spread percentile, efficiency, and current pattern. Parameters allow customization of lookback periods, volume/spread thresholds, and display options such as coloring chart bars and showing a pattern legend.
VSA is applicable across markets including Forex, stocks, indices, commodities, and crypto. Note that Forex volume reflects tick volume, which may affect pattern reliability. The indicator is designed as an analytical tool to complement price structure analysis rather than as standalone trade signals.
Avis clients
5 | 100 % | |
4 | 0 % | |
3 | 0 % | |
2 | 0 % | |
1 | 0 % |


