Description
Calculez les niveaux de support et de résistance en utilisant cinq méthodes professionnelles de pivot sur n'importe quelle période.
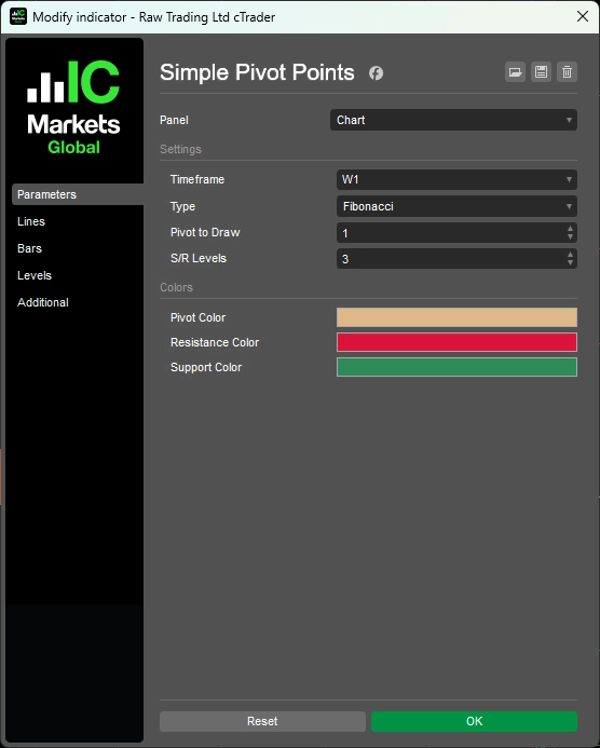
Génère automatiquement les niveaux de pivot (Standard, Fibonacci, Woodie, Camarilla, DeMark) à partir des données M5 à Mensuelles avec affichage limité dans le temps pour chaque période.
Cinq algorithmes de calcul avec une logique distincte d'espacement S/R, niveaux de support/résistance configurables (0-6 par côté), affichage historique des pivots pour plusieurs périodes précédentes, lignes auto-étiquetées (PP, R1-R6, S1-S6) et visualisation codée par couleur offrant une analyse de pivot de qualité institutionnelle pour les traders ciblant les niveaux de prix clés et les retournements intrajournaliers.
FONCTIONNALITÉS
Cinq méthodes de calcul
- Standard : Formule classique des traders de salle — les pivots les plus suivis dans le monde
- Fibonacci : Utilise les ratios Fib (38,2 %, 61,8 %, 100 %, 138,2 %, 161,8 %) pour l'espacement S/R
- Woodie : Donne un poids important au prix de clôture — plus réactif à l'action récente des prix
- Camarilla : Niveaux intrajournaliers serrés utilisant des multiplicateurs 1,1/12 — populaire pour le scalping
- DeMark : Formule conditionnelle basée sur la relation clôture vs. ouverture — un seul niveau S/R mais très respecté
Personnalisation complète
- Toute période : Calcul à partir des données M5, H1, H4, Quotidiennes, Hebdomadaires, Mensuelles
- Pivots historiques : Affiche jusqu'à plusieurs périodes précédentes (par exemple, les 3 dernières semaines de pivots)
- Niveaux configurables : Affiche 0 à 6 niveaux de support/résistance par côté
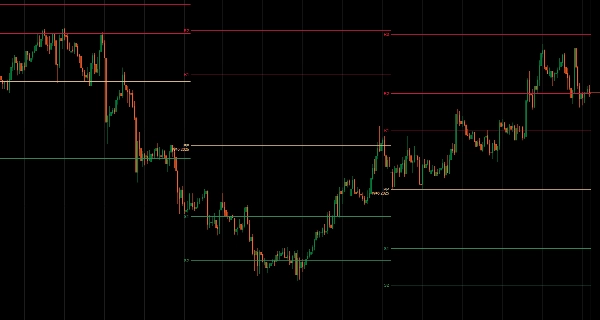
- Lignes auto-étiquetées : PP, R1-R6, S1-S6 clairement marqués
- Lignes limitées dans le temps : Les pivots de chaque période sont affichés uniquement pendant la durée de cette période
- Codage couleur : Pivot (beige), Résistance (rouge), Support (vert)
__________________________________________________________________________________________
PLUS D'INDICATEURS GRATUITS
Explorez une large gamme d'outils d'analyse de marché — de la structure et du volume à la régression, la volatilité et les périodes personnalisées.
Le code source est disponible sur le dépôt GitHub.
Tous gratuits à utiliser. Mais si vous souhaitez offrir un café en soutien, vous pouvez le faire ici.
Support/Résistance
Volume
- Profileur d'activité de volume
- Analyseur d'efficacité du volume
- Analyse du profil de volume
- Profil de volume - Mis à jour
- Analyse de la répartition du volume
- VWAP (Prix moyen pondéré par le volume)
Moyennes mobiles
- Canal SSL
- Moyenne mobile ancrée
- Moyenne mobile à échelle de déviation
- Activateur Gann Haut Bas
- Ligne de tendance instantanée
- MA adaptative Kaufman avec vision de tendance
- Canal de moyenne mobile
- Suite de moyennes mobiles
- Moyenne mobile du canal de tendance
Utilitaires/Personnalisé
Basé sur la régression
Volatilité
Oscillateurs
__________________________________________________________________________________________
AVERTISSEMENT
Le trading comporte des risques. Cet indicateur est destiné uniquement à l'analyse technique — appliquez toujours une gestion des risques appropriée et tradez de manière responsable.
RETROACTION & AMÉLIORATIONS
Si vous avez des suggestions, des demandes de fonctionnalités ou des idées d'amélioration, veuillez laisser un commentaire dans l'onglet Discussion. Vos retours aident à améliorer l'indicateur pour tous.
Résumé
Avis clients
5 | 100 % | |
4 | 0 % | |
3 | 0 % | |
2 | 0 % | |
1 | 0 % |