Описание
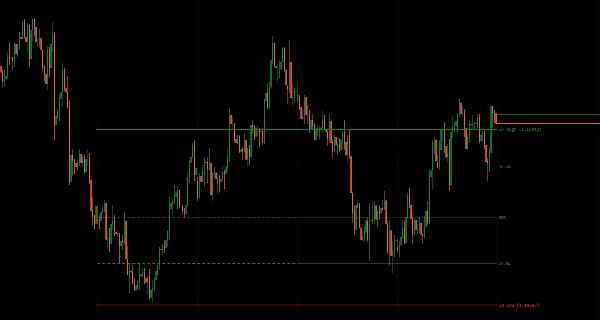
Структура начального диапазона для любого периода — от внутридневных сессий до годовых циклов — с уровнями Фибоначчи и проекциями расширения.
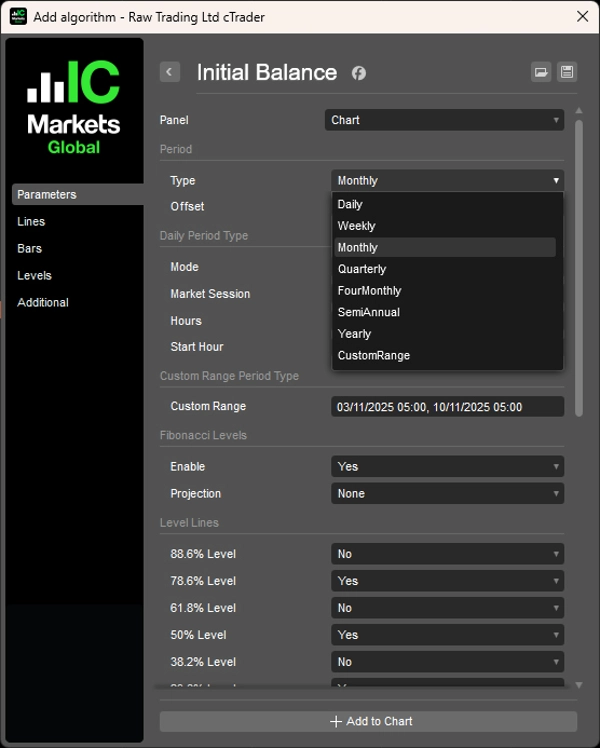
Отмечает установленный в начальные периоды (ежедневный, еженедельный, ежемесячный, квартальный, годовой или пользовательский диапазон) максимум/минимум диапазона в качестве ориентира для пробоев, возврата к среднему и ожиданий волатильности.
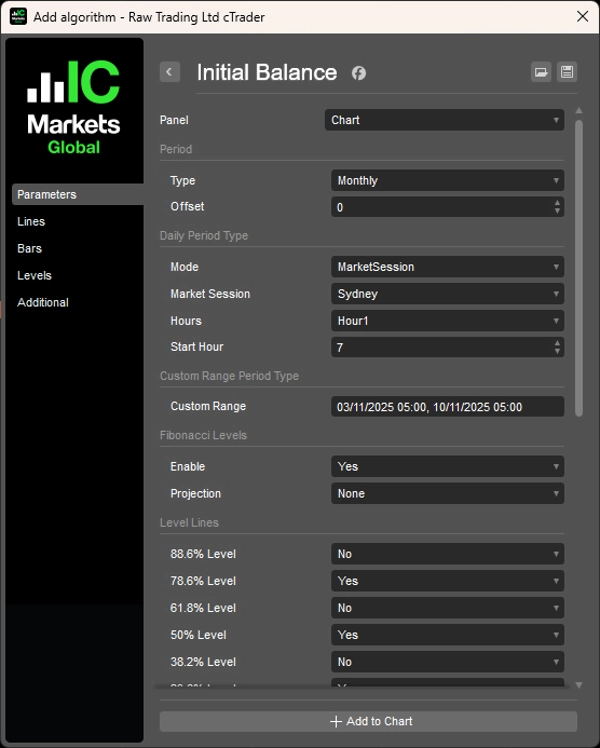
Восемь типов периодов с определением сессий с учётом часового пояса (Сидней/Токио/Лондон/Нью-Йорк), историческим смещением для сравнения нескольких периодов, опциональными семью уровнями Фибоначчи (от 11,4% до 88,6%) внутри диапазона IB, проекциями вверх/вниз от границ, гибким управлением расширением линий (только период IB, текущий бар или N периодов вперёд) и точным определением периода обеспечивают всесторонний анализ начального диапазона для трейдеров, ориентированных на структуры во всех таймфреймах.
ОСОБЕННОСТИ
8 типов периодов
- Ежедневный, еженедельный, ежемесячный, квартальный, 4-месячный, полугодовой, годовой, пользовательский диапазон
- Ежедневные режимы: на основе часов (1-12 часов) или рыночной сессии (Сидней/Токио/Лондон/Нью-Йорк)
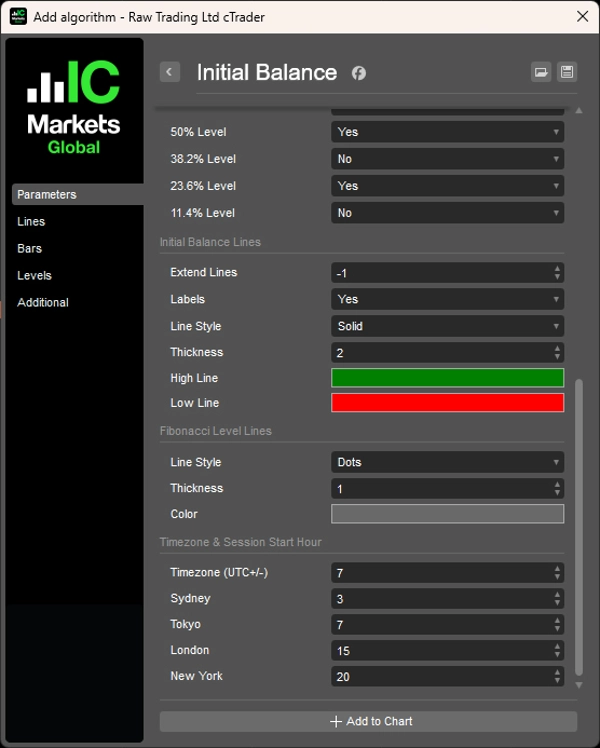
- Настраиваемое время начала сессии с учётом смещения UTC и часового пояса
- Пользовательский диапазон: определение точного времени начала/окончания для анализа событий
Исторические периоды
- Параметр смещения для просмотра прошлых диапазонов IB (например, IB прошлой недели, IB прошлого месяца)
- Сравнение текущего ценового действия с предыдущими структурами периодов
- Мультипериодный анализ для подтверждения тренда
Уровни Фибоначчи
- Опциональные 7 уровней (11,4%, 23,6%, 38,2%, 50%, 61,8%, 78,6%, 88,6%) внутри диапазона IB
- Зоны возврата к среднему внутри баланса
- Точные точки входа/выхода
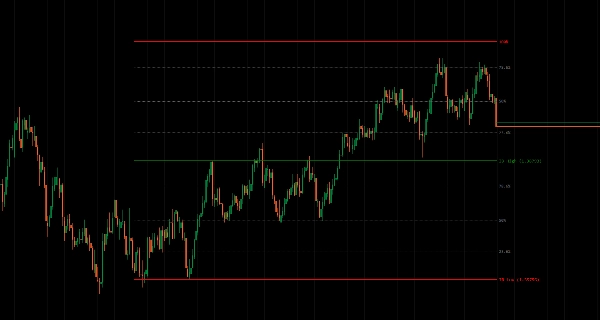
Проекции Фибоначчи
- Проекция уровней вверх/вниз от максимума/минимума IB
- Потенциальные цели пробоя за пределами диапазона
- Зоны расширения для направленных движений
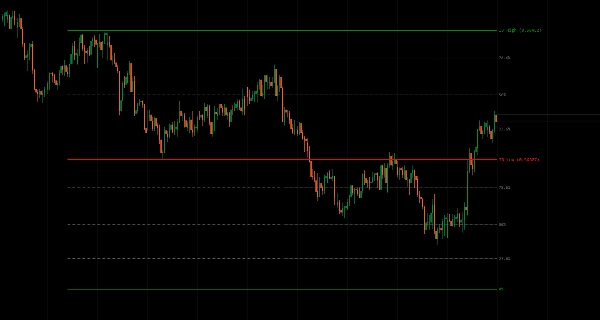
Управление расширением линий
- Только период IB: отображение диапазона во время формирования
- Текущий бар: расширение до настоящего времени
- N периодов вперёд: проекция в будущее для планирования
- Чистое визуальное управление
Точное определение периода
- Точное вычисление начального диапазона для каждого типа периода
- Учет часовых поясов для глобальных рынков
- Чистая обработка перекрытий и переходов сессий
__________________________________________________________________________________________
БОЛЬШЕ БЕСПЛАТНЫХ ИНДИКАТОРОВ
Изучите широкий спектр инструментов анализа рынка — от структуры и объёма до регрессии, волатильности и пользовательских таймфреймов.
Исходный код доступен в репозитории на GitHub repository.
Все бесплатно для использования. Но если хотите поддержать кофе, можете сделать это здесь.
Поддержка/Сопротивление
Объём
- Volume Activity Profiler
- Volume Efficiency Analyzer
- Volume Profile Analytics
- Volume Profile - Updated
- Volume Spread Analysis
- VWAP (объёмно-взвешенная средняя цена)
Скользящие средние
- SSL Channel
- Anchored Moving Average
- Deviation-Scaled Moving Average
- Gann High Low Activator
- Instantaneous Trendline
- Kaufman Adaptive MA with Trend Vision
- Moving Average Channel
- Moving Averages Suite
- Trend Channel Moving Average
Утилиты/Пользовательские
Регрессионные
Волатильность
Осцилляторы
__________________________________________________________________________________________
ОТКАЗ ОТ ОТВЕТСТВЕННОСТИ
Торговля связана с риском. Этот индикатор предназначен только для технического анализа — всегда применяйте надлежащее управление рисками и торгуйте ответственно.
ОБРАТНАЯ СВЯЗЬ И УЛУЧШЕНИЯ
Если у вас есть предложения, запросы на функции или идеи для улучшения, пожалуйста, оставьте комментарий во вкладке Обсуждение. Ваш отзыв помогает улучшить индикатор для всех.
Сводка
Key features include configurable session start times with UTC offset adjustments, historical offset parameters for comparing past initial balance ranges, and multi-period analysis for trend confirmation. It offers optional Fibonacci retracement levels (11.4% to 88.6%) within the initial balance range to highlight mean reversion zones and precise entry or exit points. Additionally, Fibonacci projections extend upward or downward from the initial balance boundaries to indicate potential breakout targets and directional extension zones.
Line extension controls allow users to display the range during its formation, extend it to the current bar, or project it forward for planning purposes. The indicator ensures precise period detection, handling session overlaps and transitions accurately for global market analysis. This tool aids traders in identifying breakout, mean reversion, and volatility expectations based on opening range structures across all timeframes.
Отзывы покупателей
5 | 50 % | |
4 | 50 % | |
3 | 0 % | |
2 | 0 % | |
1 | 0 % |