
RT ATR Bands
Chỉ báo
2 lượt mua
Phiên bản 1.0, Sep 2024
Windows, Mac
Mô tả
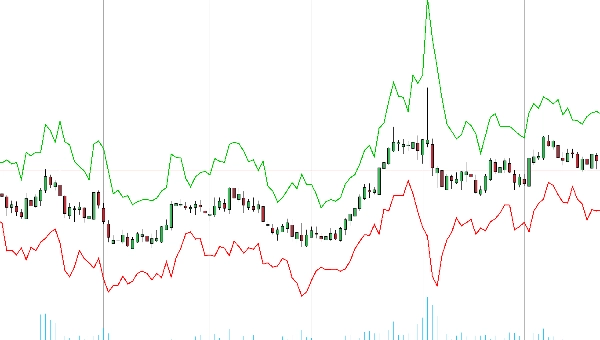
Dải ATR hiển thị động các dải trên và dưới trên biểu đồ giá của bạn.
Các dải này cung cấp cái nhìn thời gian thực về biến động thị trường, giúp bạn xác định chính xác các điểm bứt phá và đảo chiều tiềm năng. Phù hợp cho các nhà giao dịch ở mọi cấp độ, Dải ATR nâng cao quá trình ra quyết định của bạn bằng cách cung cấp các tín hiệu trực quan rõ ràng để thiết lập điểm dừng lỗ, chốt lời và tối ưu hóa điểm vào lệnh.
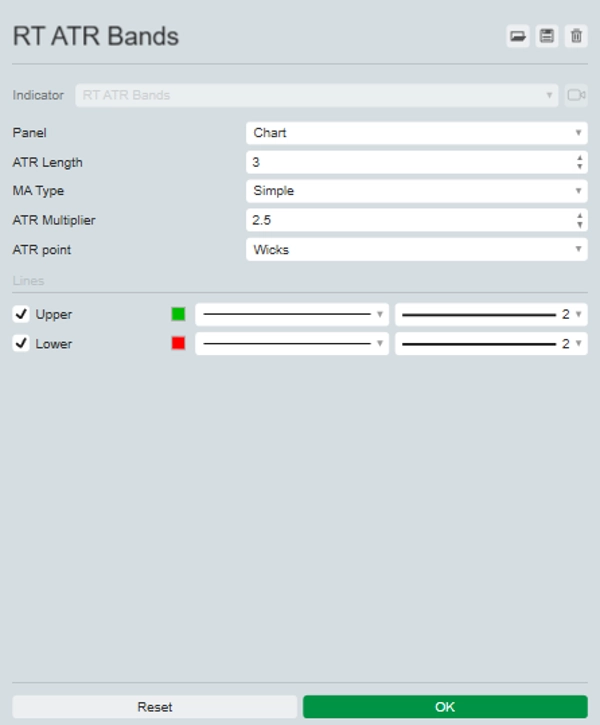
Các cài đặt cho phép bạn chọn khoảng thời gian và hệ số nhân ưa thích, thay đổi trung bình động được sử dụng để tính ATR và sử dụng bấc nến hoặc giá đóng cửa nến.
Nâng cấp bộ công cụ giao dịch của bạn ngay hôm nay và trải nghiệm sự khác biệt với Dải ATR – lợi thế của bạn trên thị trường.
Tóm tắt
Tóm tắt AI
RT ATR Bands is a technical indicator that dynamically plots upper and lower bands on price charts based on the Average True Range (ATR). These bands provide real-time visualization of market volatility, assisting traders in identifying potential breakout and reversal points with greater precision. The indicator supports customization of key parameters, including the ATR calculation period, multiplier, choice of moving average, and whether to use candle wicks or candle closes for calculations. It is applicable across various markets such as Forex, cryptocurrencies (e.g., BTCUSD), commodities, indices, and stocks. By offering clear visual cues, RT ATR Bands aids in setting stop-loss and take-profit levels and optimizing trade entries, making it suitable for traders of all experience levels.
Hồ sơ chỉ báo
Đánh giá của khách hàng
0.0
Đánh giá: 0
Đánh giá của khách hàng
Sản phẩm này chưa có đánh giá nào. Bạn đã dùng thử chưa? Hãy là người đầu tiên chia sẻ với mọi người!
Thảo luận
Câu hỏi thường gặp
BTCUSD
Forex
Breakout
Indices
EURUSD
Commodities
GBPUSD
NZDUSD
Prop
Crypto
Stocks
XAUUSD
NAS100
ATR
USDJPY
Các sản phẩm có sẵn trên cTrader Store, bao gồm bot giao dịch, chỉ báo và plugin, được cung cấp bởi các nhà phát triển bên thứ ba và chỉ nhằm mục đích cung cấp thông tin và tiếp cận kỹ thuật. cTrader Store không phải là nhà môi giới và không cung cấp lời khuyên đầu tư, khuyến nghị cá nhân hay bất kỳ đảm bảo nào về hiệu suất trong tương lai.


Giá
Kể từ 25/09/2024
20
Lượt bán