
Chandelier Exit
Chỉ báo
5 lượt mua
Phiên bản 1.0, Oct 2025
Windows, Mac
4.3
Đánh giá: 3
Mô tả
Giới thiệu chỉ báo Chandelier Exit, công cụ tối ưu để thoát giao dịch với độ chính xác và sự tự tin.
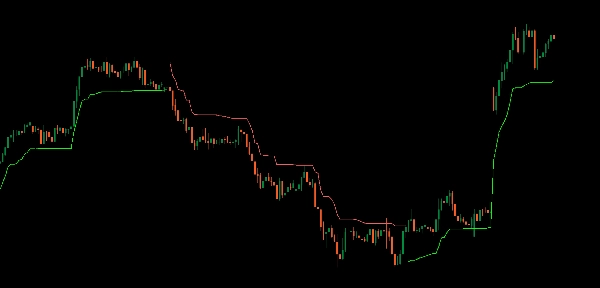
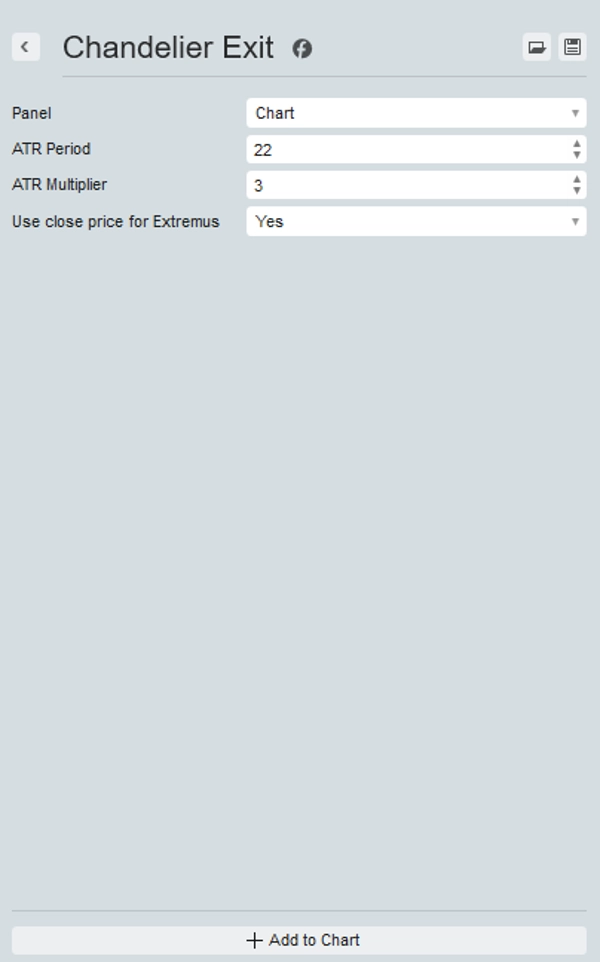
Chỉ báo này tính toán điểm dừng lỗ động dựa trên mức cao nhất và ATR, cung cấp các tín hiệu trực quan rõ ràng trên biểu đồ của bạn theo thời gian thực.
Được thiết kế để giúp bạn khóa lợi nhuận và bảo vệ khỏi các biến động ngược chiều thị trường, Chandelier Exit đảm bảo bạn luôn đi trước xu hướng.
Hoàn hảo cho các nhà giao dịch muốn nâng cao chiến lược với các tín hiệu thoát đáng tin cậy, chỉ báo này cung cấp cách tiếp cận trực quan, đơn giản để quản lý rủi ro. Nâng cấp bộ công cụ giao dịch của bạn và bảo vệ lợi nhuận với Chandelier Exit.
Tóm tắt
Tóm tắt AI
The Chandelier Exit indicator dynamically calculates stop-loss levels based on the highest high price and the Average True Range (ATR). It provides real-time visual cues on trading charts to help traders optimize exit points, lock in profits, and protect against market reversals. Suitable for various markets including Forex, cryptocurrencies, stocks, commodities, and indices, it supports symbols such as BTCUSD, EURUSD, GBPUSD, XAUUSD, NAS100, and USDJPY. The indicator offers a straightforward, visual method for managing risk and enhancing trading strategies by signaling reliable exit points.
Hồ sơ chỉ báo
Đánh giá của khách hàng
4.3
Đánh giá: 3
5 | 33 % | |
4 | 67 % | |
3 | 0 % | |
2 | 0 % | |
1 | 0 % |
Đánh giá của khách hàng
October 9, 2025
Decent tool for testing if the trader wants it keeps trade control closer to the plan. It works best as support, not a final decision maker. The best use is 1 percent risk per trade, BE after 1R and partials near 1.5R. incorrect settings can give a false sense of safety.
October 8, 2025
October 8, 2025
Useful extra check for traders who care about risk before entries. It gives value around risk management, but incorrect settings can give a false sense of safety. I would check 30 trades and compare DD before and after the tool, aiming for less than 3 percent monthly DD. It is useful when the trader already respects stops and sizing.
Thảo luận
Câu hỏi thường gặp
BTCUSD
Forex
Signal
Indices
EURUSD
Commodities
GBPUSD
NZDUSD
Prop
Scalping
Crypto
Stocks
XAUUSD
NAS100
ATR
USDJPY
Các sản phẩm có sẵn trên cTrader Store, bao gồm bot giao dịch, chỉ báo và plugin, được cung cấp bởi các nhà phát triển bên thứ ba và chỉ nhằm mục đích cung cấp thông tin và tiếp cận kỹ thuật. cTrader Store không phải là nhà môi giới và không cung cấp lời khuyên đầu tư, khuyến nghị cá nhân hay bất kỳ đảm bảo nào về hiệu suất trong tương lai.


Giá
Kể từ 25/09/2025
25
Lượt bán
315
Cài đặt miễn phí