
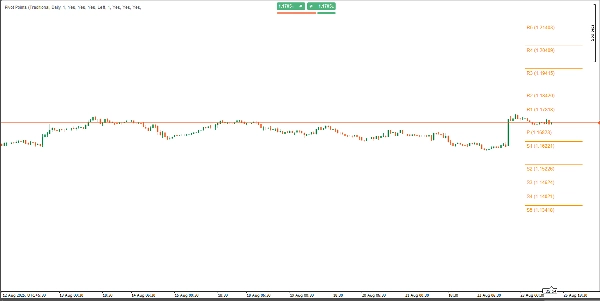
Pivot Point Daily Indicator
Chỉ báo
14 lượt mua
Phiên bản 2.0, May 2026
Windows, Mac
4.2
Đánh giá: 4
Mô tả
Tính Năng Chính:
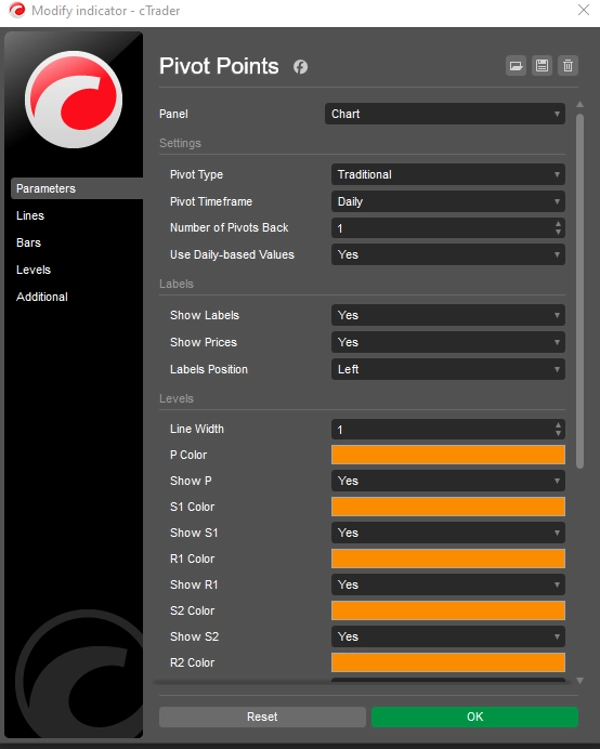
- Nhiều Phong Cách Pivot: Chuyển đổi liền mạch giữa sáu phương pháp tính pivot: Cổ điển, Fibonacci, Woodie, Camarilla, DM và Truyền thống. Mỗi phương pháp hỗ trợ các mức khác nhau (tối đa R5/S5 cho Truyền thống và Camarilla, R3/S3 cho Fibonacci, và P/R1/S1 cho DM).
- Khung Thời Gian Linh Hoạt: Chọn từ nhiều khung thời gian pivot, bao gồm Tự động, Hàng ngày, Hàng tuần, Hàng tháng, Hàng quý, Hàng năm và các tùy chọn nhiều năm (Hai năm, Ba năm, Năm năm, Mười năm). Hoàn hảo để phù hợp với tầm nhìn giao dịch của bạn.
- Kiểm Soát Pivot Lịch Sử: Đặt số lượng bộ pivot lịch sử hiển thị (1–200) với tham số Số Pivot Lùi Lại, đảm bảo biểu đồ không bị rối trong khi vẫn giữ các mức lịch sử quan trọng.
- Giao Diện Tùy Chỉnh: Màu sắc, độ rộng đường và cài đặt nhãn hoàn toàn có thể điều chỉnh. Bật/tắt nhãn và giá, chọn vị trí nhãn (Trái hoặc Phải) với các khoảng cách dọc thông minh để rõ ràng.
- Dữ Liệu Hàng Ngày hoặc Trong Ngày: Tùy chọn sử dụng giá trị dựa trên ngày hoặc dữ liệu khung thời gian biểu đồ, cung cấp sự linh hoạt cho các chiến lược giao dịch khác nhau.
- Hiệu Suất Tối Ưu: Mã cTrader gốc nhẹ giúp cập nhật nhanh, thời gian thực không bị trễ, tương thích với Forex, chỉ số, hàng hóa, tiền điện tử và nhiều hơn nữa.
Tại Sao Chọn Pivot Points Standard?
- Công Cụ Giao Dịch Đa Năng: Xác định các mức hỗ trợ/kháng cự chính, hướng xu hướng và cơ hội bứt phá trên bất kỳ thị trường hoặc khung thời gian nào.
- Giao Diện Thân Thiện Người Dùng: Menu thả xuống trực quan cho loại pivot, khung thời gian và vị trí nhãn giúp tùy chỉnh dễ dàng.
- Phân Tích Lịch Sử: Hiển thị lên đến 200 bộ pivot lịch sử để nghiên cứu các tương tác giá trong quá khứ và hoàn thiện chiến lược của bạn.
- Biểu Đồ Sạch Sẽ: Vị trí nhãn thông minh và độ dài đường có thể tùy chỉnh giúp tránh rối mắt biểu đồ, nâng cao khả năng đọc.
Cách Sử Dụng:
- Áp dụng chỉ báo vào biểu đồ cTrader của bạn.
- Chọn Loại Pivot ưa thích (ví dụ: Fibonacci, Camarilla) và Khung Thời Gian Pivot (ví dụ: Hàng ngày, Hàng tháng).
- Điều chỉnh Số Pivot Lùi Lại để kiểm soát các bộ lịch sử hiển thị.
- Tùy chỉnh màu sắc, độ rộng đường và cài đặt nhãn phù hợp với phong cách của bạn.
- Sử dụng các mức pivot để xác định hỗ trợ/kháng cự, đặt dừng lỗ/chốt lời hoặc giao dịch bứt phá.
Phù Hợp Cho:
- Nhà Giao Dịch Ngày: Tận dụng pivot Hàng ngày hoặc Hàng tuần cho các lệnh vào và ra trong ngày.
- Nhà Giao Dịch Swing: Sử dụng pivot Hàng tháng hoặc Hàng quý để nắm bắt xu hướng dài hạn hơn.
- Nhà Giao Dịch Lướt Sóng: Kết hợp với các khung thời gian thấp hơn để giao dịch nhanh và chính xác.
- Tất Cả Thị Trường: Hoạt động mượt mà trên Forex, cổ phiếu, tiền điện tử và hàng hóa.
Tăng Cường Sự Tự Tin Trong Giao Dịch
Với Pivot Points Standard, bạn có quyền truy cập vào một công cụ mạnh mẽ, tất cả trong một giúp đơn giản hóa phân tích kỹ thuật và nâng cao khả năng phát hiện các cơ hội giao dịch có xác suất cao. Dù bạn là người mới bắt đầu hay nhà giao dịch dày dạn kinh nghiệm, chỉ báo này sẽ thích ứng với chiến lược của bạn, cung cấp các mức rõ ràng, có thể hành động để nâng tầm trò chơi giao dịch của bạn. Hãy thử Pivot Points Standard ngay hôm nay và kiểm soát giao dịch của bạn với độ chính xác và rõ ràng! Thanh toán một lần. Truy cập trọn đời. Bao gồm các cập nhật trong tương lai.
Tóm tắt
Tóm tắt AI
Pivot Point Daily Indicator is a multi-timeframe pivot point tool designed for the cTrader platform. It supports six pivot calculation methods—Classic, Fibonacci, Woodie, Camarilla, DM, and Traditional—each offering various resistance and support levels (up to R5/S5 for some methods). Users can select from a broad range of timeframes including Auto, Daily, Weekly, Monthly, Quarterly, Yearly, and multi-year intervals, allowing alignment with different trading horizons.
The indicator allows displaying up to 200 historical pivot sets to analyze past price interactions while maintaining chart clarity through customizable label positions and line settings. It offers options to use daily-based or intraday data, enhancing flexibility for diverse trading strategies.
Pivot Point Daily Indicator is optimized for real-time performance with native cTrader coding, compatible across Forex, indices, commodities, cryptocurrencies, and other markets. Its interface includes intuitive dropdown menus for pivot type, timeframe, and label customization.
Traders can use this indicator to identify key support and resistance levels, trend directions, and breakout opportunities, aiding in setting stop-loss and take-profit points. It suits various trading styles including day trading, swing trading, and scalping across multiple asset classes.
Hồ sơ chỉ báo
Danh mục chỉ báo
Hỗ trợ & kháng cự
Loại đầu ra
Bộ lọc
Yêu cầu dữ liệu
Chỉ dữ liệu nến
Tín hiệu được hỗ trợ
Phá ngưỡng
Đánh giá của khách hàng
4.2
Đánh giá: 4
5 | 25 % | |
4 | 75 % | |
3 | 0 % | |
2 | 0 % | |
1 | 0 % |
Đánh giá của khách hàng
May 2, 2026
Bought it, added it, used it for a while, and now it's disappeared, and I cannot get it back!
August 28, 2025
Good helper for review if the trader wants it keeps attention on levels that actually matter. It works best as support, not a final decision maker. The cleanest use is 3 to 5 levels per chart, with 0.5 pullbacks checked before entry. not every zone holds, even if it looks clean.
August 27, 2025
August 27, 2025
Usable tool with purpose for traders who build plans around market levels. It gives value around key price zones, but not every zone holds, even if it looks clean. I would wait for 2 reactions and avoid trades where the target is less than 1.5R. Levels are useful when they reduce noise, not when they crowd the chart.
Thảo luận
Câu hỏi thường gặp
Fibonacci
Prop
Forex
Breakout
Indices
Commodities
Các sản phẩm có sẵn trên cTrader Store, bao gồm bot giao dịch, chỉ báo và plugin, được cung cấp bởi các nhà phát triển bên thứ ba và chỉ nhằm mục đích cung cấp thông tin và tiếp cận kỹ thuật. cTrader Store không phải là nhà môi giới và không cung cấp lời khuyên đầu tư, khuyến nghị cá nhân hay bất kỳ đảm bảo nào về hiệu suất trong tương lai.


Giá
Kể từ 30/05/2025
40
Lượt bán