
Mô tả
Lưu ý: Đã thử nghiệm chỉ trên cTrader Windows.
LT_Ind_Pivot là một chỉ báo Pivot Point mạnh mẽ, có thể tùy chỉnh cho cTrader giúp trực quan hóa các mức thị trường chính và cấu trúc phiên giao dịch trên nhiều khung thời gian.
Nó tự động tính toán và vẽ Pivot (P), Hỗ trợ (S1–S5), Kháng cự (R1–R5), và CPR (TC/BC) dựa trên khung thời gian mỏ neo bạn chọn — từ H1, H4, H8, H12, D1, W1, đến Month1.
Chỉ báo cũng vẽ các đường phân cách dọc cho mỗi khoảng thời gian mỏ neo, cả trên biểu đồ chính và các bảng chỉ báo, giúp dễ dàng phân biệt ranh giới phiên hoặc khoảng thời gian.
Bạn có thể xác định chính xác các mức muốn hiển thị bằng cách sử dụng ký hiệu linh hoạt như:
P, S1, R1– các mức tiêu chuẩnPS1,S1S2,R1R2, v.v. – các mức trung gian giữa các pivot và các mức hỗ trợ/kháng cự chínhTC,BC– Phạm vi Pivot Trung tâm (CPR)
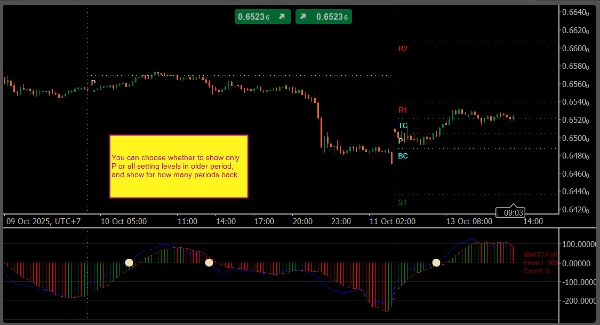
Các điều khiển hiển thị cho phép bạn đặt số lượng pivot lịch sử giữ hiển thị, có hiển thị nhãn văn bản/giá hay không, và cách tô màu hoặc kiểu dáng cho từng mức.
Tính Năng Chính
- Mỏ neo pivot: H1, H4, H8, H12, D1, W1, Month1
- Cú pháp mức tùy chỉnh:
P, Sx, Rx, PS1, S1S2, R1R2, TC, BC - Các đường phân cách khoảng thời gian dọc trên biểu đồ và bảng chỉ báo
- Tùy chọn hiển thị văn bản, giá và các mức pivot cũ
- Tùy chỉnh đầy đủ màu sắc và kiểu đường
- Nhẹ và phù hợp cho giao dịch trực tiếp
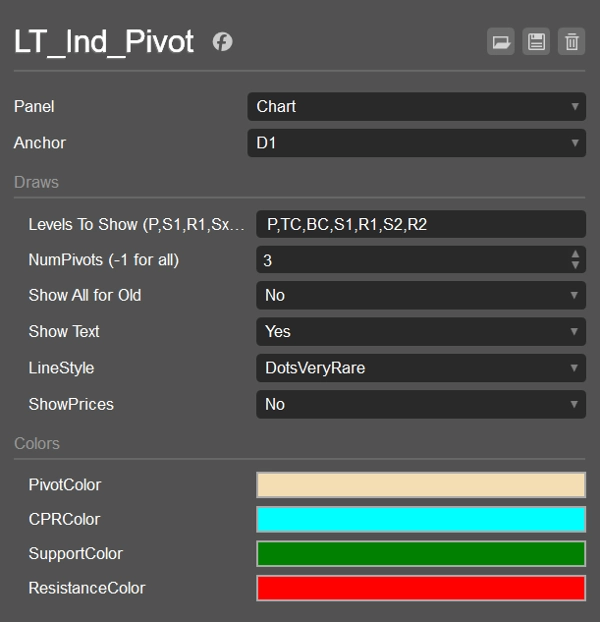
Cài Đặt Mặc Định
- Mỏ neo: D1
- Hiển thị các mức:
P,S1,R1 - Số pivot lịch sử: 1
- Hiển thị tất cả cho các pivot cũ: false
- Hiển thị văn bản: true
- Hiển thị giá: false
- Kiểu đường: Solid
- Màu sắc: Pivot = Wheat, CPR = Cyan, Hỗ trợ = Green, Kháng cự = Red
Các Trường Hợp Sử Dụng
- Đánh dấu các vùng hỗ trợ/kháng cự trong ngày và swing
- Theo dõi CPR và các mức trung gian cho các thiết lập phá vỡ hoặc hồi quy trung bình
- Sử dụng đường phân cách khoảng thời gian để phân tích cấu trúc từng phiên
- Kết hợp với các chỉ báo VWAP hoặc Swing để tăng độ đồng thuận
Tóm tắt
Đánh giá của khách hàng
5 | 0 % | |
4 | 100 % | |
3 | 0 % | |
2 | 0 % | |
1 | 0 % |


