
LT_SmartSwings
Chỉ báo
6 lượt mua
Phiên bản 1.0, Jun 2025
Windows, Mac
5.0
Đánh giá: 1
Mô tả
Lưu ý: Đã thử nghiệm chỉ trên cTrader Windows.
LT_SmartSwings là một chỉ báo cấu trúc thị trường dựa trên swing mạnh mẽ được thiết kế để giúp các nhà giao dịch hình dung các điểm xoay quan trọng, các chuyển động thị trường và các sự kiện bứt phá một cách rõ ràng và linh hoạt. Được xây dựng để chính xác và thích ứng, công cụ này lý tưởng cho các nhà giao dịch dựa vào logic swing, sự hội tụ Fibonacci và phân tích bứt phá.
Các tính năng chính:
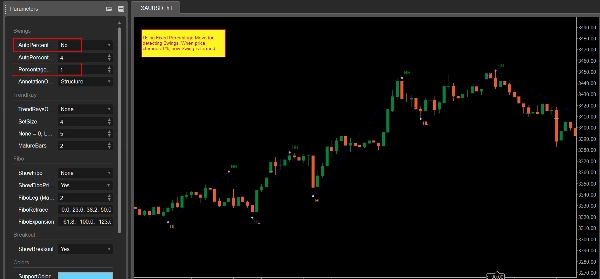
- Phát hiện Swing Cao/Thấp dựa trên phần trăm biến động giá
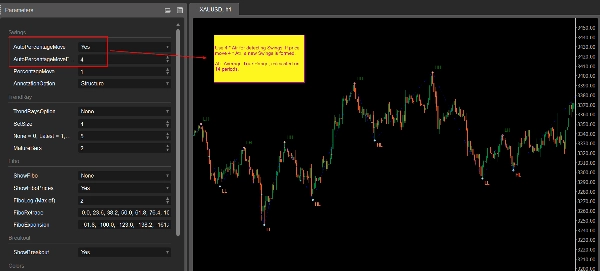
- Ngưỡng Tự động hoặc Thủ công: Sử dụng % cố định hoặc chế độ tự động (dựa trên ATR x hệ số)
- Đường ZigZag kết nối các swing chính
- Chú thích Chi tiết với 5 chế độ:
-
- Cấu trúc: HH, HL, LH, LL
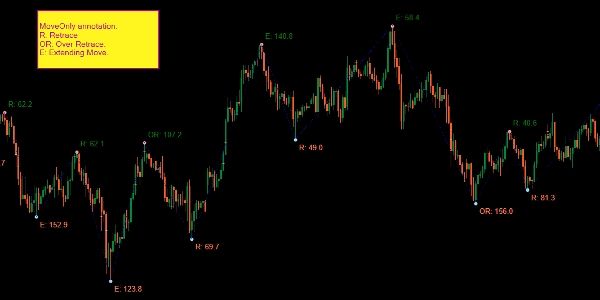
- Chỉ Di chuyển: Phần trăm Retrace (R) và Extension (E)
- Chỉ Giá
- Di chuyển và Giá
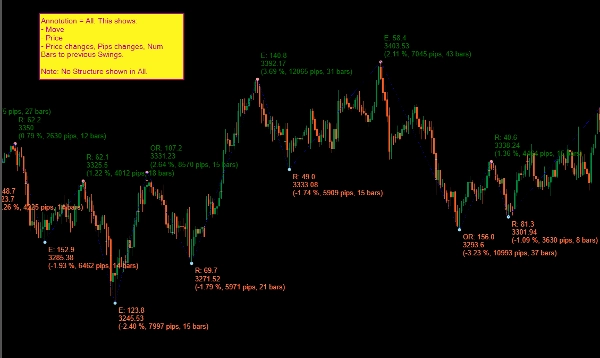
- Tất cả: phần trăm di chuyển, pips, bars, giá, loại di chuyển
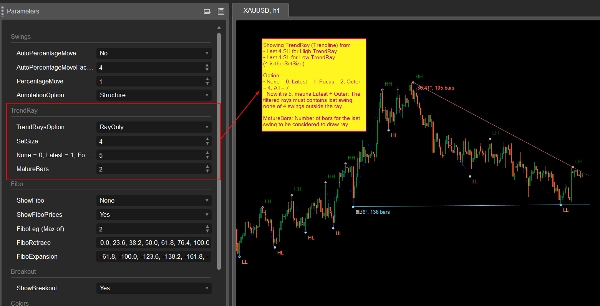
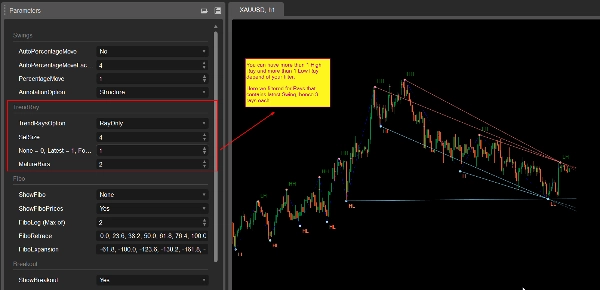
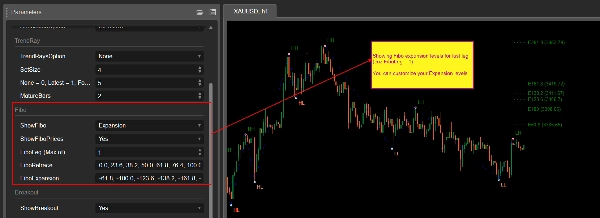
- Chiếu Tia Xu hướng (với nhiều tùy chọn lọc):
-
- Vẽ tia từ các swing gần đây sử dụng các ràng buộc thông minh
- Tùy chọn: Mới nhất, Tập trung (độ dốc), Ngoài cùng, hoặc Tất cả
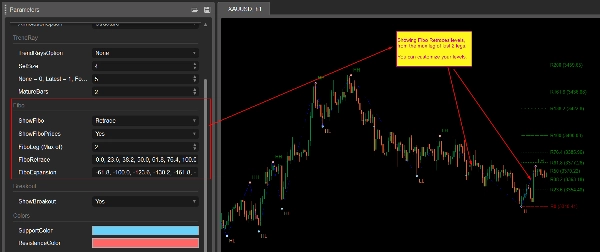
- Mức Fibonacci Tự động:
-
- Vẽ các mức Retracement hoặc Expansion dựa trên các chuyển động gần đây
- Bộ mức có thể cấu hình bởi người dùng
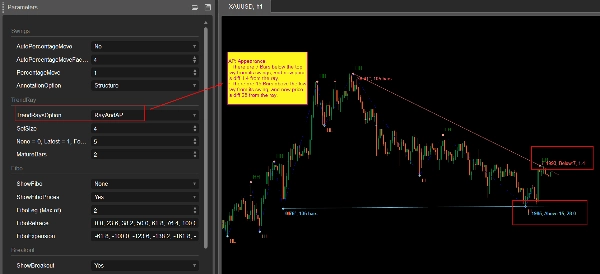
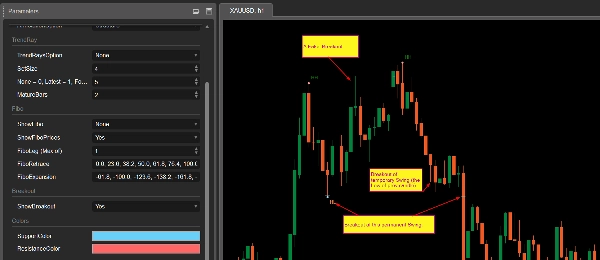
- Đánh dấu Bứt phá:
-
- Phát hiện bứt phá các điểm swing (cả bứt phá xác nhận và bứt phá giả)
- Hiển thị liên tục để tham khảo lịch sử
- Tùy chỉnh Màu sắc cho các đường hỗ trợ/kháng cự
Các trường hợp sử dụng:
- Xác định hỗ trợ/kháng cự một cách động
- Hiểu cấu trúc swing và các chuyển đổi
- Phát hiện tiếp diễn hoặc đảo chiều xu hướng sử dụng Fibonacci
- Hình dung các điểm bứt phá để lập kế hoạch giao dịch
- Kết hợp với các hệ thống hiện có hoặc chiến lược tùy ý của bạn
Sử dụng được khuyến nghị:
- Gắn vào khung thời gian làm việc của bạn (ví dụ: M30, H1)
- Phù hợp nhất cho các nhà giao dịch thủ công, nhà phân tích cấu trúc và các chiến lược dựa trên xác nhận
Ưu đãi ra mắt: Hiện có chỉ với $15!
Tóm tắt
Tóm tắt AI
LT_SmartSwings is a swing-based market structure indicator designed for traders to identify key turning points, market moves, and breakout events with precision and flexibility. It detects swing highs and lows based on price movement percentage, using either fixed or automatic thresholds derived from ATR. The indicator connects key swings with a ZigZag line and provides detailed annotations in five modes, including structure (HH, HL, LH, LL), move percentages, price-only, combined move and price, and comprehensive move data.
Additional features include trend ray projection with multiple filtering options, automatic Fibonacci retracement and expansion levels customizable by the user, and breakout marking that detects both confirmed and false breakouts with persistent historical display. Support and resistance lines can be color-customized.
Use cases cover dynamic support/resistance identification, understanding swing structure and transitions, spotting trend continuation or reversal via Fibonacci levels, visualizing breakout points for trade planning, and integration with existing trading systems or discretionary strategies. It is recommended for manual traders, structure analysts, and confirmation-based strategies, and is intended for use on working timeframes such as M30 or H1. The indicator has been tested on cTrader Windows.
Hồ sơ chỉ báo
Đánh giá của khách hàng
5.0
Đánh giá: 1
5 | 100 % | |
4 | 0 % | |
3 | 0 % | |
2 | 0 % | |
1 | 0 % |
Thảo luận
Câu hỏi thường gặp
Breakout
ATR
Các sản phẩm có sẵn trên cTrader Store, bao gồm bot giao dịch, chỉ báo và plugin, được cung cấp bởi các nhà phát triển bên thứ ba và chỉ nhằm mục đích cung cấp thông tin và tiếp cận kỹ thuật. cTrader Store không phải là nhà môi giới và không cung cấp lời khuyên đầu tư, khuyến nghị cá nhân hay bất kỳ đảm bảo nào về hiệu suất trong tương lai.


Giá
Kể từ 25/09/2024
34
Lượt bán