
LT_Ind_SRZones
Chỉ báo
3 lượt mua
Phiên bản 1.0, Oct 2025
Windows, Mac
4.6
Đánh giá: 3
Mô tả
Lưu ý: Đã thử nghiệm chỉ trên cTrader Windows.
LT_Ind_SRZones phát hiện các đỉnh/đáy dao động, gộp các dao động gần nhau thành vùng Hỗ trợ/Kháng cự, và giữ biểu đồ của bạn tập trung vào các mức quan trọng nhất quanh giá hiện tại.
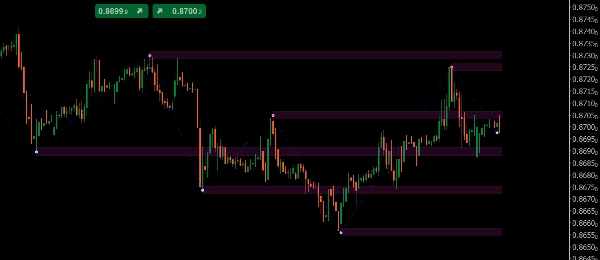
Những gì nó vẽ
- Vùng: các dải bóng được xây dựng từ các dao động đã gộp
- Điểm Đỉnh/Đáy Dao động
- Đường ZigZag để đọc cấu trúc nhanh
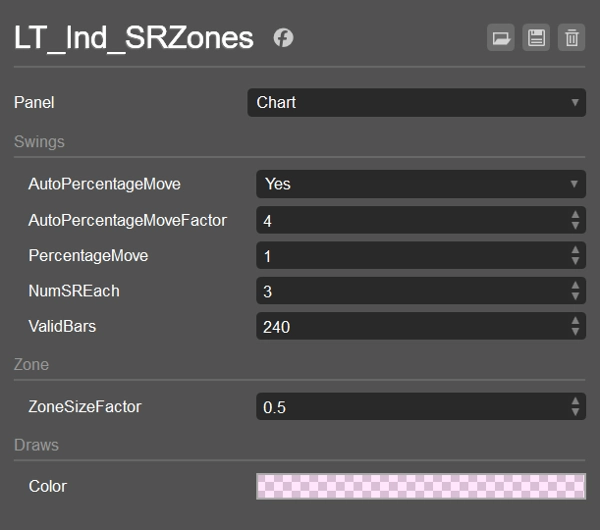
Các điều khiển chính
- AutoPercentageMove (bool) + AutoPercentageMoveFactor (double)
Tự động điều chỉnh độ nhạy dao động. Tắt để sử dụng PercentageMove thủ công. - PercentageMove (double)
Di chuyển tối thiểu (tính theo %) để hình thành một dao động khi Auto tắt. - ZoneSizeFactor (double)
Chiều cao vùng =ZoneSizeFactor × ATR. - NumSREach (int)
Số lượng vùng hàng đầu giữ phía trên và phía dưới giá hiện tại. - ValidBars (int)
Bỏ qua các dao động cũ hơn số lượng thanh này. - Màu sắc / Kiểu hiển thị
Màu nền vùng (kèm alpha), kiểu Swing/ZZ.
Logic Sắp xếp & Lọc (cách chọn vùng)
- Thu thập dao động từ gần nhất trở về trước, chỉ những dao động vĩnh viễn và không cũ hơn
ValidBars. - Đếm dao động phía trên và phía dưới giá hiện tại (bao gồm những dao động có giá trị nằm trong nửa vùng). Dừng khi cả hai bên đạt
NumSREach. - Phương án dự phòng: nếu một bên không có dao động hợp lệ, thêm một dao động cũ hơn cho bên đó.
- Gộp: với mỗi dao động được chọn, hoặc gộp vào vùng hiện có (
CanMerge) hoặc tạo vùng mới. - Xếp hạng & chọn:
-
- Phía trên giá: sắp xếp vùng theo (High − price) tăng dần, sau đó theo MostRecentIndex giảm dần; lấy
NumSREach. - Phía dưới giá: sắp xếp theo (price − Low) tăng dần, sau đó theo MostRecentIndex giảm dần; lấy
NumSREach. - Hợp nhất hai danh sách → vùng cuối cùng hiển thị.
- Phía trên giá: sắp xếp vùng theo (High − price) tăng dần, sau đó theo MostRecentIndex giảm dần; lấy
Điều này giữ cho hiển thị gọn gàng, gần gũi và mới nhất, đồng thời vẫn xử lý các trường hợp đặc biệt.
Mặc định
- AutoPercentageMove = true, AutoPercentageMoveFactor = 4
- PercentageMove = 1.0 (dùng khi Auto = false)
- NumSREach = 1
- ValidBars = 240
- ZoneSizeFactor = 0.5 (chiều cao vùng = 0.5 × ATR)
- Màu vùng = #21FF33E0 (bán trong suốt)
- Đỉnh Dao động = #FFFF999A, Đáy Dao động = #FF99DFF9, ZigZag = Xanh dương (Chấm)
Các trường hợp sử dụng
- Đánh dấu các vùng H/K gần đó cho các điểm vào lệnh, thoát một phần hoặc dừng lỗ
- Theo dõi sự đảo chiều vùng (hỗ trợ → kháng cự và ngược lại)
- Kết hợp với VWAP/Pivots để tăng độ tin cậy
Hoạt động trên mọi ký hiệu và khung thời gian. Nhẹ và sẵn sàng cho giao dịch trực tiếp hoặc kiểm tra lại.
Tóm tắt
Tóm tắt AI
LT_Ind_SRZones is an indicator designed for cTrader Windows that automatically identifies and displays support and resistance zones derived from swing highs and lows. It detects swing points, merges nearby swings into shaded support/resistance zones, and highlights the most relevant levels around the current price to maintain a clear chart view. The indicator also plots swing high/low points and a ZigZag path for quick structural analysis.
Key adjustable parameters include automatic or manual swing sensitivity settings, zone size based on a factor of the Average True Range (ATR), the number of top zones to display above and below the current price, and the maximum age of swings considered. The indicator filters and ranks zones by proximity and recency, ensuring the display focuses on recent and nearby levels.
LT_Ind_SRZones works on any symbol and timeframe, supporting markets such as Forex, indices, commodities, cryptocurrencies, and stocks. It is suitable for live trading and backtesting. Typical use cases include marking nearby support/resistance zones for trade entries, stops, or partial exits, monitoring zone flips (support to resistance and vice versa), and combining with other indicators like VWAP or pivots for confluence.
Hồ sơ chỉ báo
Đánh giá của khách hàng
4.6
Đánh giá: 3
5 | 67 % | |
4 | 33 % | |
3 | 0 % | |
2 | 0 % | |
1 | 0 % |
Đánh giá của khách hàng
October 22, 2025
October 15, 2025
the routine feels easier to keep, but the chart still needs a human read.
Thảo luận
Câu hỏi thường gặp
Prop
Forex
Indices
Commodities
Crypto
Stocks
Các sản phẩm có sẵn trên cTrader Store, bao gồm bot giao dịch, chỉ báo và plugin, được cung cấp bởi các nhà phát triển bên thứ ba và chỉ nhằm mục đích cung cấp thông tin và tiếp cận kỹ thuật. cTrader Store không phải là nhà môi giới và không cung cấp lời khuyên đầu tư, khuyến nghị cá nhân hay bất kỳ đảm bảo nào về hiệu suất trong tương lai.


Giá
Kể từ 25/09/2024
34
Lượt bán