
Mô tả
Chỉ báo CRT (Candle Range Theory) là một công cụ phân tích mạnh mẽ được thiết kế đặc biệt cho các nhà giao dịch theo phương pháp ICT (Inner Circle Trader). Chỉ báo này xác định các mẫu nến quan trọng liên quan đến CRT, điều này rất quan trọng để hiểu các chuyển động thị trường và hành động giá.
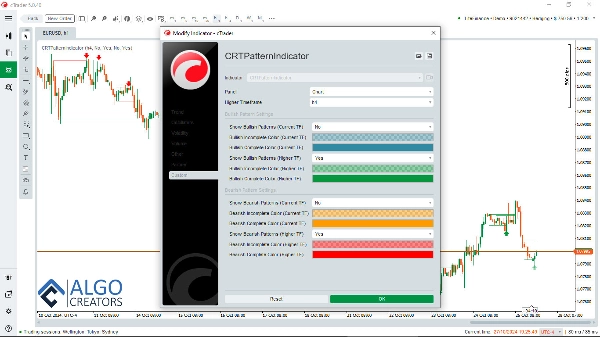
Chỉ báo cTrader CRT được trang bị khả năng đa khung thời gian, cho phép các nhà giao dịch xem các mẫu CRT khung thời gian cao hơn (HTF) trong khi hoạt động trên các khung thời gian thấp hơn (LTF). Tính năng này rất quan trọng để có cái nhìn sâu sắc về cấu trúc tổng thể của thị trường và cải thiện quyết định giao dịch.
Chuyển động giá và ICT Power of 3 (AMD):
Chỉ báo CRT đơn giản hóa việc phân tích chuyển động giá và nhận diện mẫu liên quan đến Power of 3 của ICT (Anatomy of Market Dynamics - AMD).
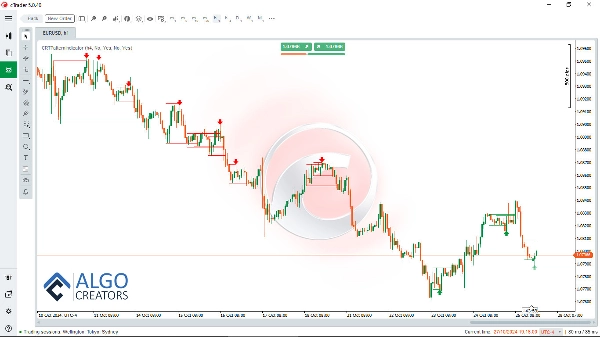
LTF CRT trong một HTF CRT:
Bằng cách dễ dàng xác định các điểm hỗ trợ và kháng cự chính, các nhà giao dịch có thể phân tích hành động giá một cách rõ ràng hơn nhiều. Ngoài ra, chỉ báo CRT làm nổi bật các mẫu HTF và LTF, giúp các nhà giao dịch điều hướng các động lực của các chu kỳ thị trường khác nhau.
Sử dụng chỉ báo CRT với các khái niệm giao dịch khác:
Kết hợp CRT với các khái niệm giao dịch khác như FVGs, order blocks và turtle soup làm tăng khả năng xác định các giao dịch thành công.
Hơn nữa, chỉ báo CRT đóng vai trò như một bổ sung vô giá cho Smart Money Assistant , một công cụ tiên tiến được thiết kế để hỗ trợ các nhà giao dịch smart money với những hiểu biết quan trọng về thị trường và quyết định. Kết hợp lại, hai chỉ báo này tạo thành một bộ công cụ giao dịch toàn diện giúp nâng cao khả năng phân tích và hành động của nhà giao dịch.
Tải Smart Money Assistant: https://ctrader.com/algos/show/3956/
Để tăng cường hơn nữa các chiến lược giao dịch, chỉ báo FVG Finder có thể được sử dụng cùng với chỉ báo CRT. Công cụ này phát hiện các khoảng trống Giá Trị Công Bằng (FVGs) trên biểu đồ, khi được sử dụng kết hợp với các tín hiệu CRT, sẽ tăng khả năng thực hiện các giao dịch thành công.
Tải chỉ báo FVG finder: https://ctrader.com/algos/show/3877/
Bằng cách tích hợp các chỉ báo này, các nhà giao dịch có thể thiết lập một hệ thống vững chắc tận dụng các thiết lập có xác suất cao, giúp họ điều hướng thị trường hiệu quả và tối ưu hóa kết quả giao dịch.
Tải chỉ báo CRT với Cảnh báo:: www[dot]AlgoCreators[dot]net
Với CRT, Smart Money Assistant và FVG Finder trong bộ công cụ của bạn, bạn có thể tối đa hóa hiểu biết về xu hướng thị trường và cải thiện hiệu suất giao dịch tổng thể, làm cho nó trở thành một tài nguyên thiết yếu cho các nhà giao dịch mong muốn xuất sắc trong phong cách giao dịch ICT.
Tóm tắt
It simplifies the recognition of price movements related to ICT’s Power of 3 (Anatomy of Market Dynamics - AMD) and highlights critical support and resistance levels. By displaying both higher and lower timeframe patterns, it helps traders interpret market cycles more clearly.
The CRT indicator can be combined with other trading concepts such as Fair Value Gaps (FVGs), order blocks, and turtle soup patterns to enhance trade identification. It also complements the Smart Money Assistant indicator, providing a comprehensive toolkit for smart money trading analysis.
Additionally, pairing the CRT indicator with the FVG Finder, which detects Fair Value Gaps, can improve the probability of successful trades. Together, these tools support the development of robust trading strategies aligned with the ICT style.
Đánh giá của khách hàng
5 | 83 % | |
4 | 17 % | |
3 | 0 % | |
2 | 0 % | |
1 | 0 % |


