
Beschreibung
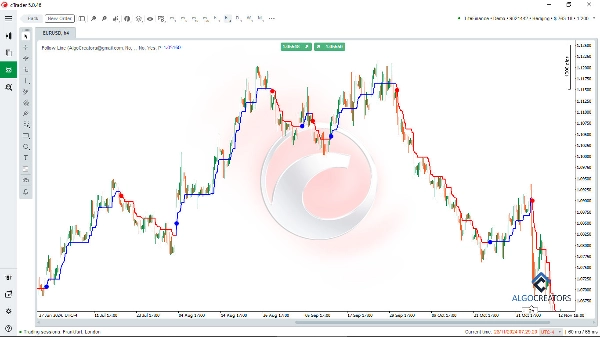
Der Follow Line Indikator ist ein leistungsstarker cTrader-Indikator für die technische Analyse, der Händlern hilft, optimale Ein- und Ausstiegspunkte auf den Finanzmärkten zu identifizieren. Durch die Kombination von Bollinger-Bändern und dem ATR-Indikator filtert er Trends und liefert zuverlässige Kauf- und Verkaufssignale.
Mit diesem Indikator können Sie leicht Aufwärts- oder Abwärtstrends am Markt erkennen und Signale mit hoher Zuverlässigkeit verfolgen.
Händler können den Follow Line Indikator mit fortschrittlichen Werkzeugen wie dem cTrader Smart Money Assistant Indikator und Oszillatoren wie MACD kombinieren, um ihre Analyse zu verbessern und Handels-Einstiege zu bestätigen.
Seine anpassbaren Einstellungen und Echtzeit-Benachrichtigungen machen ihn zu einer wertvollen Ergänzung jeder Handelsstrategie, die es den Nutzern ermöglicht, erfolgreiche Trades mit Vertrauen und Genauigkeit auszuführen.
Hauptmerkmale:
- Trenderkennung: Verwenden Sie den Follow Line, um bullische oder bärische Markttrends zu identifizieren.
- Kauf-/Verkaufssignale: Zeigt genaue Kauf- und Verkaufssignale basierend auf Ausbrüchen der Bollinger-Bänder an.
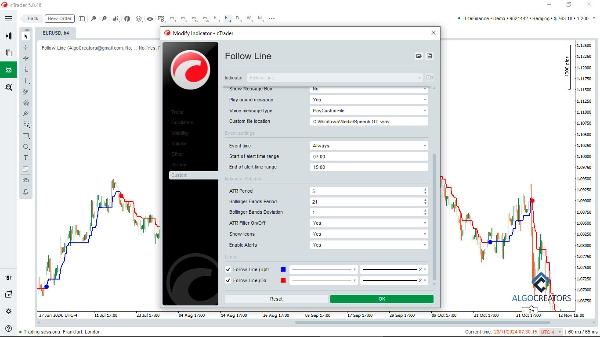
- ATR-Filter: Möglichkeit, den ATR-Filter zur Verbesserung der Signalgenauigkeit zu aktivieren oder zu deaktivieren.
- Anpassbare Einstellungen: Passen Sie die Periode der Bollinger-Bänder, die Standardabweichung und die ATR-Periode an.
- Visuelle Darstellung: Zeigt Signale im Chart mit intuitiven Symbolen (Pfeile oder Linien) an.
- Benachrichtigungen: Erhalten Sie sofortige Benachrichtigungen, sobald ein Kauf- oder Verkaufssignal erscheint.
Dieser Indikator ist hochgradig anpassbar und ermöglicht es Händlern, die Perioden der Bollinger-Bänder, Standardabweichungen und ATR-Einstellungen an ihre Strategie anzupassen. Visuelle Hinweise und sofortige Benachrichtigungen machen ihn benutzerfreundlich und effektiv sowohl für Scalping als auch Swing-Trading. Mit Funktionen wie Trenderkennung, Risikomanagement und anpassbaren Einstellungen ist der Follow Line Indikator ideal für Forex-, Kryptowährungs- und Aktienhändler, die ihre technische Analyse und Handelsleistung verbessern möchten.
Perfekt, um präzise Marktchancen zu identifizieren!
Zusammenfassung
Users can customize settings such as Bollinger Bands period, standard deviation, and ATR period to align with their trading strategies. The indicator visually represents signals on the chart using intuitive icons like arrows or lines and provides real-time alerts when signals occur. It supports various trading styles, including scalping and swing trading, and is suitable for forex, cryptocurrency, and stock markets.
The Follow Line indicator can be combined with other tools like the cTrader Smart Money Assistant and MACD oscillators to confirm trade entries and enhance analysis. Its customizable features and alert system assist traders in identifying precise market opportunities and managing risk effectively.
Kundenbewertungen
5 | 60 % | |
4 | 20 % | |
3 | 20 % | |
2 | 0 % | |
1 | 0 % |


