
Beschreibung
Der CRT (Candle Range Theory) Indikator ist ein leistungsstarkes Analysewerkzeug, das speziell für Trader entwickelt wurde, die der ICT (Inner Circle Trader) Methodik folgen. Dieser Indikator identifiziert wesentliche Kerzenmuster, die mit dem CRT verbunden sind, was entscheidend für das Verständnis von Marktbewegungen und Preisaktionen ist.
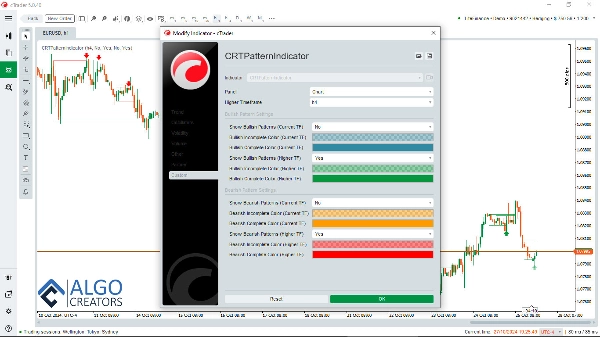
Der cTrader CRT Indikator ist mit Multi-Timeframe-Fähigkeiten ausgestattet, die es Tradern ermöglichen, CRT-Muster höherer Zeitrahmen (HTF) zu sehen, während sie auf niedrigeren Zeitrahmen (LTF) arbeiten. Diese Funktionalität ist wichtig, um Einblicke in die Gesamtmarktstruktur zu gewinnen und Handelsentscheidungen zu verbessern.
Preisbewegung und ICT Power of 3 (AMD):
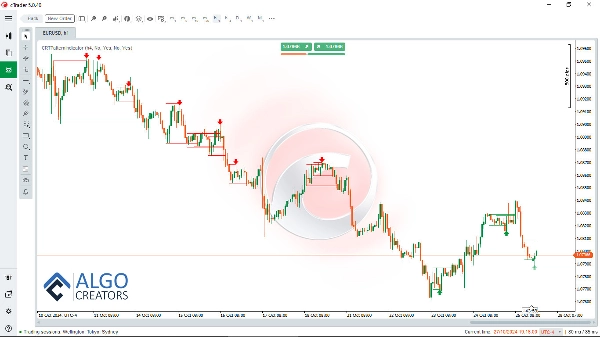
Der CRT Indikator vereinfacht die Analyse von Preisbewegungen und die Mustererkennung, die mit ICTs Power of 3 (Anatomy of Market Dynamics - AMD) verbunden sind.
LTF CRT innerhalb eines HTF CRT:
Durch die mühelose Identifizierung der wichtigsten Unterstützungs- und Widerstandspunkte können Trader die Preisaktion viel klarer analysieren. Zusätzlich hebt der CRT Indikator HTF- und LTF-Muster hervor, die Tradern helfen, die Dynamik verschiedener Marktzyklen zu navigieren.
Verwendung des CRT Indikators mit anderen Handelskonzepten:
Die Kombination von CRT mit anderen Handelskonzepten wie FVGs, Order Blocks und Turtle Soup erhöht die Wahrscheinlichkeit, erfolgreiche Trades zu identifizieren.
Darüber hinaus dient der CRT Indikator als unschätzbare Ergänzung zum Smart Money Assistant Indikator, einem fortschrittlichen Werkzeug, das Smart Money Trader mit wichtigen Markteinblicken und Entscheidungsunterstützung hilft. Zusammen bilden diese beiden Indikatoren eine ganzheitliche Handelswerkzeugkiste, die die Fähigkeit des Traders zur Analyse und zum Handeln verbessert.
Smart Money Assistant herunterladen: https://ctrader.com/algos/show/3956/
Um Handelsstrategien weiter zu verbessern, kann der FVG Finder Indikator zusammen mit dem CRT Indikator verwendet werden. Dieses Tool erkennt Fair Value Gaps (FVGs) im Chart, die in Verbindung mit CRT-Signalen die Wahrscheinlichkeit erfolgreicher Trades erhöhen.
FVG Finder Indikator herunterladen: https://ctrader.com/algos/show/3877/
Durch die Integration dieser Indikatoren können Trader ein robustes System etablieren, das auf hochwahrscheinlichen Setups basiert und ihnen ermöglicht, die Märkte effektiv zu navigieren und ihre Handelsergebnisse zu optimieren.
CRT Indikator mit Alerts herunterladen:: www[dot]AlgoCreators[dot]net
Mit dem CRT, Smart Money Assistant und FVG Finder in Ihrem Werkzeugkasten können Sie Ihr Verständnis von Markttrends maximieren und Ihre gesamte Handelsleistung verbessern, was es zu einer unverzichtbaren Ressource für Trader macht, die im ICT-Handelsstil erfolgreich sein möchten.
Zusammenfassung
It simplifies the recognition of price movements related to ICT’s Power of 3 (Anatomy of Market Dynamics - AMD) and highlights critical support and resistance levels. By displaying both higher and lower timeframe patterns, it helps traders interpret market cycles more clearly.
The CRT indicator can be combined with other trading concepts such as Fair Value Gaps (FVGs), order blocks, and turtle soup patterns to enhance trade identification. It also complements the Smart Money Assistant indicator, providing a comprehensive toolkit for smart money trading analysis.
Additionally, pairing the CRT indicator with the FVG Finder, which detects Fair Value Gaps, can improve the probability of successful trades. Together, these tools support the development of robust trading strategies aligned with the ICT style.
Kundenbewertungen
5 | 83 % | |
4 | 17 % | |
3 | 0 % | |
2 | 0 % | |
1 | 0 % |


